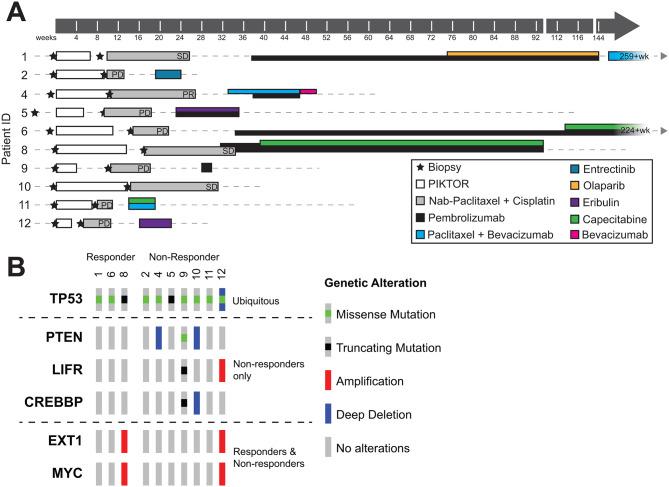
Fig. 2.
Clinical biopsy and treatment timeline and genetic characterization. (A) Clinical timeline of pre- and post-PIKTOR biopsies, time on PIKTOR treatment and follow-on therapies. Time 0 set at Day 1 of PIKTOR regimen. Arrows indicate survival at last follow up as indicated. (B) Oncoprint summarizing somatic mutations and copy number alterations in known oncogenic driver genes from COSMIC cancer gene consensus in pre-PIKTOR biopsies. Only recurrently altered genes are shown (see Supplemental Table 3 for full variant list). Patients are separated by long-term response, and genes are grouped by patterns of alteration in responders and non-responders

