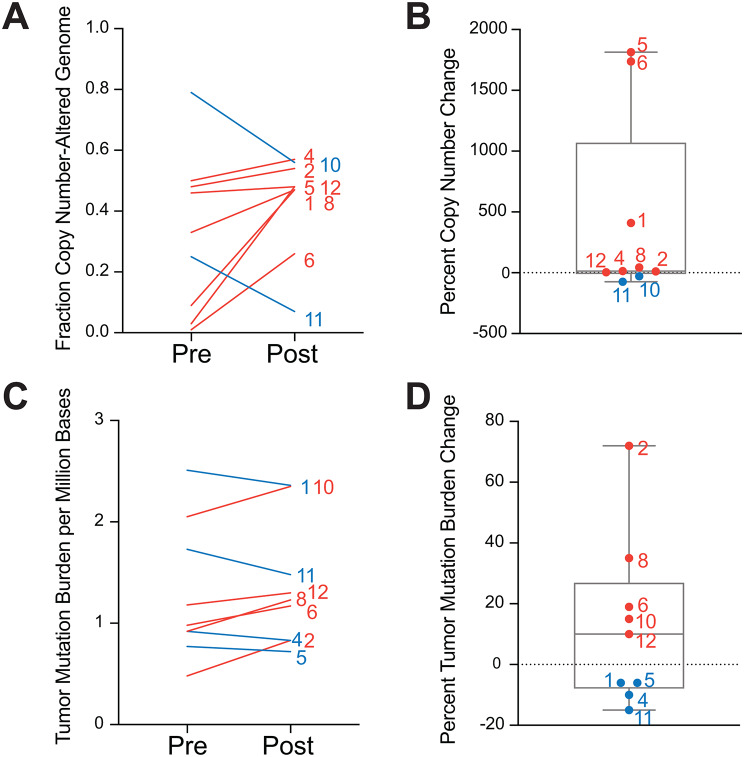
Fig. 4.
Changes in tumor mutation burden and copy number following PIKTOR treatment. (A) Individual fraction copy number-altered genome values for pre- and post- PIKTOR biopsies. Patient ID is labeled on right. (B) Percent change in fraction copy number-altered genome from (A). Boxplot shows median and upper and lower quartiles, as well as the highest and lowest values represented by error bars. Each patient is labeled with their identifier. (C) Individual tumor mutation burden per million bases for pre- and post- PIKTOR biopsies. Patient ID is labeled on right. (D) Percent change tumor mutation burden from (C). Boxplot shows median and upper and lower quartiles, as well as the highest and lowest values represented by error bars. Each patient is labeled with their identifier

