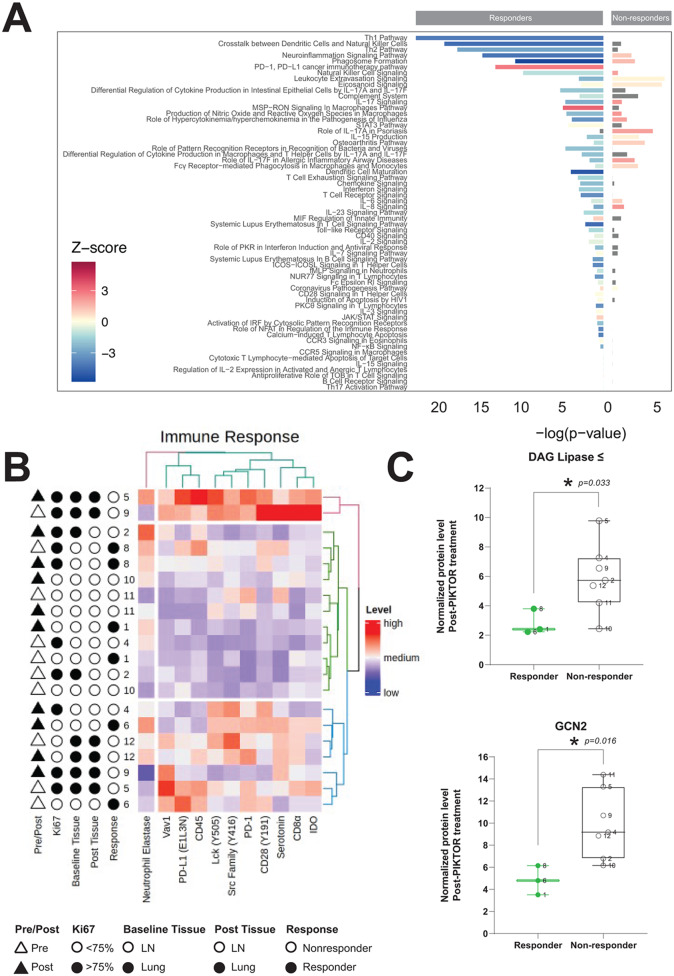
Fig. 6.
Changes to immune and inflammatory pathways with PIKTOR treatment. (A) Canonical pathway enrichment from differential gene expression results between pre- and post-PIKTOR biopsies. DESeq2 results from independent Responder and Non-responder analyses were input into Ingenuity Pathway Analysis, and results from the canonical pathway output is grouped by broader common pathways. Z-score is represented by color, and –log(p-value) is displayed by bar chart height, with values for responders extending to the left of the origin, and values for non-responders to the right. (B) Unsupervised hierarchical clustering levels of immune pathway proteins in microdissected lymph node metastasis reveals heterogeneous signaling profiles. Pre and post PIKTOR samples are represented by white and black triangles, respectively. (C) Diacylglycerol lipase Beta and General Control Non-derepressible 2 (GCN2) protein levels were significantly decreased in responders compared to non-responders following PIKTOR treatment

