Fig. 1.
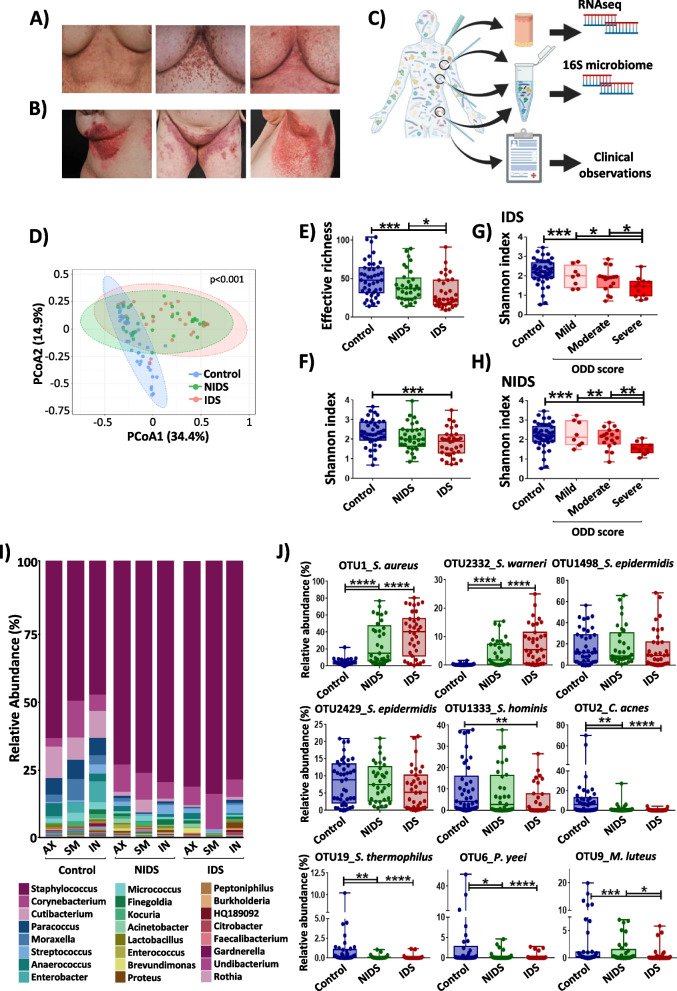
Cutaneous microbiome in DD is characterized by a reduced α-diversity and strong dysbiotic shifts. A Representative pictures for submammary skin of Darier’ patients with mild (ODD: 16.5), moderate (ODD: 29) and severe (ODD: 50.5) objective DD scores (from left to right). B Erythematous and hyperkeratotic papules observed on DD predilection areas. C Workflow of microbiome and transcriptome sampling and analysis. Samples were collected from axillary (AX), submammary (SM) and inguinal (IN) areas. Created with BioRender.com. D Principal coordinate analysis (PcoA) plot of β-diversity of microbiota from healthy, non-inflamed (NIDS) and inflamed (IDS) DD skin microbiomes. The Bray–Curtis index was used to calculate the similarity between samples and PERMANOVA to test the statistical significance based on the distance matrix. E, F α-diversity expressed as effective richness (number of OTUs) and the Shannon index are shown for control healthy skin, NIDS and IDS. Shannon index displayed according to the objective DD score for G IDS and H NIDS skin compared to control samples. I Bar chart of taxonomy binning displayed at the genus level. The taxonomic composition was assessed by summing up OTUs relative abundances that share the same assignment at the genus level. The Bayesian classifier from the RDP database was used for OTUs classification. J Relative abundances plots of dominant taxa S. aureus, S. warneri, S. epidermidis, S. hominis, C. acnes, S. thermophilus, P. yeei and M. luteus. Each dot represents a swab sample. Multiple test corrections were performed with the Benjamini and Hochberg procedures. The statistical significance was calculated using Kruskal–Wallis and Wilcoxon-Mann–Whitney tests, respectively, for multiple group and pairwise comparisons. The asterisks indicate statistically significant differences and correspond to *p ≤ 0.05, **p ≤ 0.01, ***p ≤ 0.001, and ****p ≤ 0.0001

