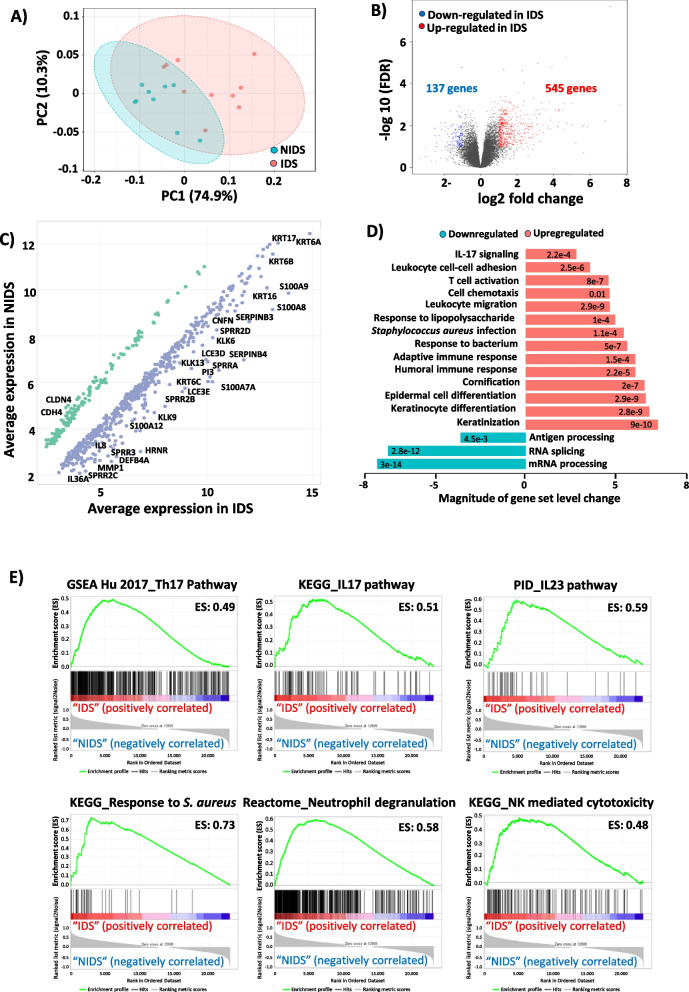
Fig. 4.
Epidermal repair and Th17 inflammatory pathways are upregulated in response to DD dysbiosis. A Principal component analysis (PCA) shows an altered gene expression profile of inflamed (IDS) compared to non-inflamed (NIDS) DD skin. B Volcano plot of fold expression change (FCH) vs false discovery rate (FDR) of the 2000 most varying genes in IDS versus NIDS transcriptomes reveals a significant upregulation of 545 differentially expressed genes (DEGs) and downregulation of 137. This plot displays the significance versus fold-change on Y and X axes, respectively. C Scatter plot of IDS versus NIDS gene expression profiles highlighting representative regulated transcripts. D Gene Ontology (GO) analysis of DD skin shows an enrichment of epidermal repair pathways and immune responses to pathogens with strong Th17 signatures. E Gene set enrichment analysis (GSEA) plots displaying representative DD-enriched immune pathways. To the far left (red) the plot shows a correlation of the gene set with the IDS phenotype and to the far right a correlation with the NIDS. The vertical black lines indicate the position of each gene within the ranked gene list. Every time a gene from the gene set is detected a hit is plotted. The green curve represents the running sum of the enrichment score of the GSEA. ES (enrichment score), KEGG (Kyoto Encyclopedia of Genes and Genomes) and PID (pathway interaction database)

