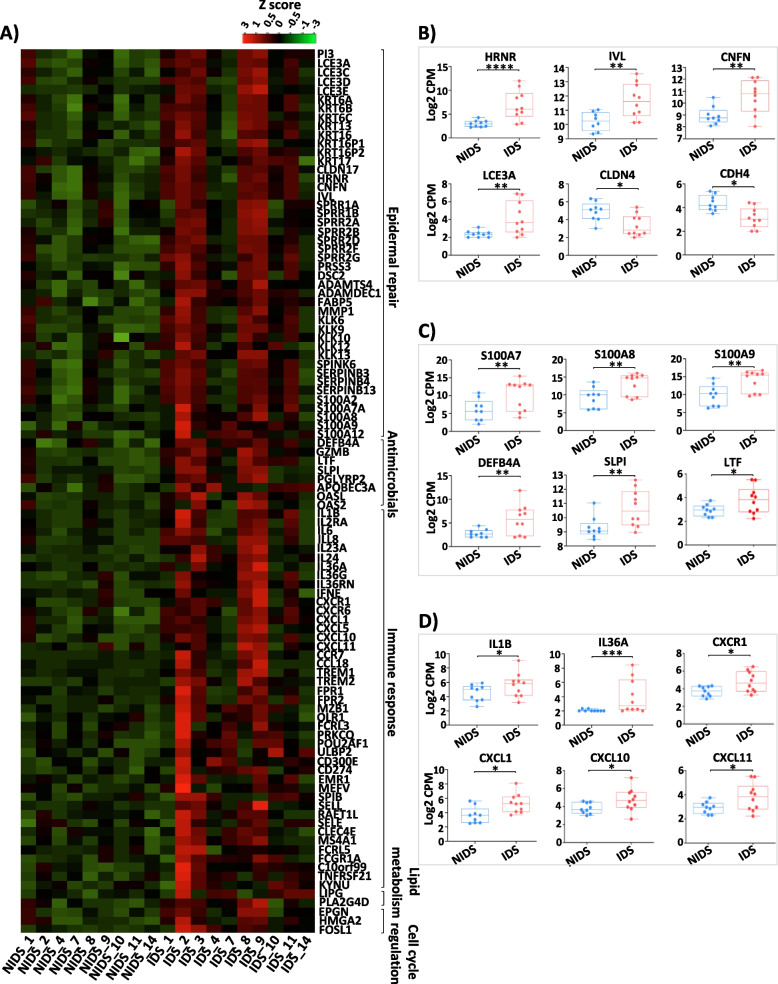
Fig. 5.
Cutaneous transcriptome reveals characteristic DD signatures. A Heat map plot of top 100 genes with high expression levels in DD skin lesions. B Normalized count per million (CPM) of selected gene representatives of the epidermal repair cluster C antimicrobial defence and D immune response clusters. DESeq2 package was used to identify the DEGs using a cutoff threshold of FDR < 0.05, adj. p < 0.05 and fold change (FCH) > 1.5. The asterisks indicate statistically significant differences and correspond to *p ≤ 0.05, **p ≤ 0.01, ***p ≤ 0.001, and ****p ≤ 0.0001

