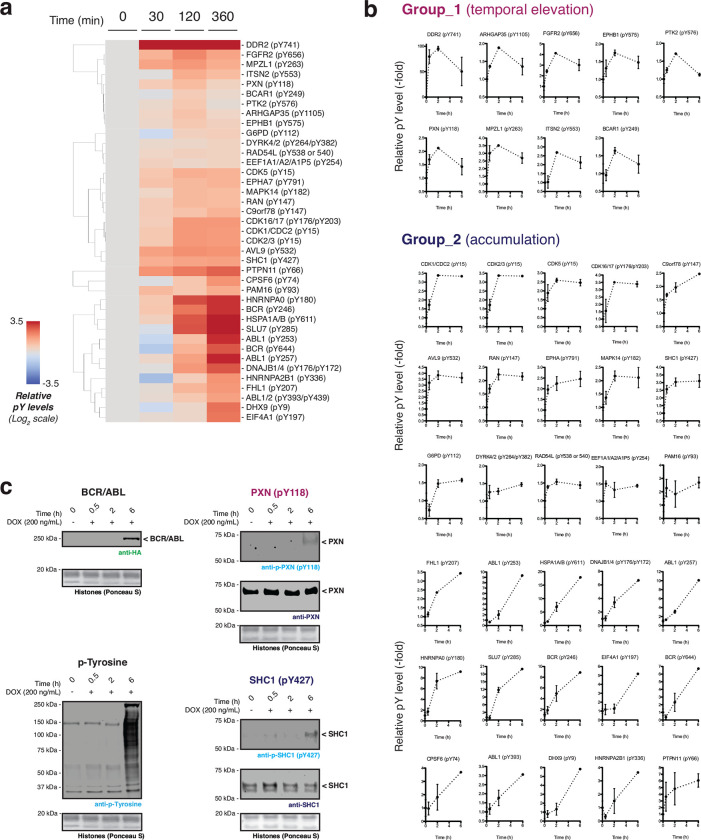
Extended Data Fig. 7 |. Dynamic tyrosine phosphorylation events following BCR/ABL activation.
a, Cluster map of the proteomics dataset representing the time-resolved phosphorylation at protein tyrosine sites, combined from three biological replicates. Data processing employing the stringency filters described in fig. S8B results in 39 representative dynamics within 6-hour timeslots. b, Phosphorylation fold-change plots of representative protein tyrosine sites as a function of time. Phosphorylation levels at each time point are normalized to the values at 0 hours (n=3. Mean with s.e.m). c, Immunoblots of tyrosine phosphorylation levels in HEK293T cells containing a Dox-inducible BCR/ABL gene expression system. BCR/ABL expressed via doxycycline (200 ng/mL) treatment for indicated time-points. Data in (a-b) were generated from n=3 independent biological replicates. Data in (c) are representative of n=3 independent experiments. CAGEN refers to ‘NpuNCage-FKBP,’ and CAGEC refers to ‘ABLauto-FRB-NpuCCage’.

