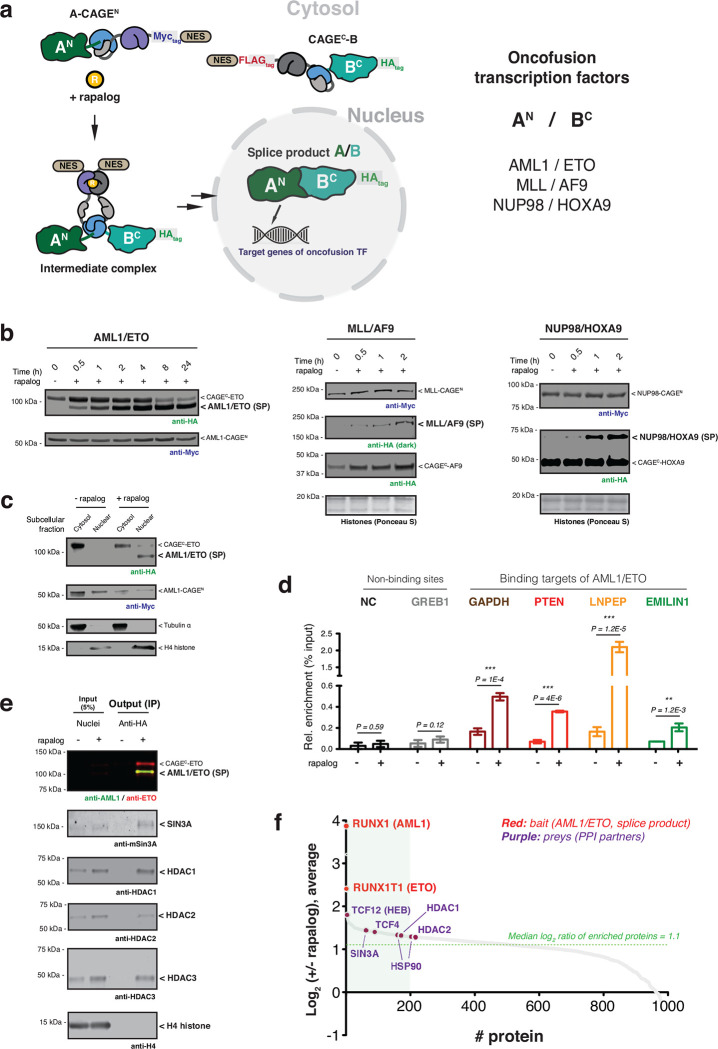
Fig. 2 |. Conditional generation of oncofusion transcription factors.
a, Schematic showing use of control elements to achieve differential subcellular compartmentalization of A-CAGEN and CAGEC-B constructs and the A/B splice product. Oncofusion transcription factors AML1/ETO, MLL/AF9, and NUP98/HOXA9 are generated by proximity-triggered CPS with this strategy. b, Immunoblots of splice products (SP, HA tagged) generated in HEK293T cells co-expressing CAGEN (Myc-tag) and CAGEC (HA-tag) constructs. Cells were treated with DMSO or rapalog (100 nM) for indicated time-points. Left – AML1/ETO. Middle – MLL/AF9. Right – NUP98/HOXA9. c, Immunoblots of the HA-tagged AML1/ETO splice product generated in HEK293T cells co-expressing AML1-CAGEN (Myc-tag) and CAGEC-ETO (HA-tag) treated with rapalog (100 nM) for 18 hours followed by a subcellular fraction to separate cytosolic and nuclear proteins. Tubulin and histone H4 serve as cytosolic and nuclear markers, respectively. d, Genomic binding of HA-tagged AML1/ETO splice product. Stable HEK293T cells expressing AML1-CAGEN and CAGEC-ETO constructs were treated with DMSO or rapalog (100 nM) for 18 hours. ChIP-qPCR was then used to amplify chromatin derived from immunoprecipitations with anti-HA antibody (n=6, mean and s.e.m.). Statistical significance was determined by two-way student’s t-tests: *P < 0.05; **P < 0.005; ***P < 0.001. e, Protein binding to the AML1/ETO splice product determined by anti-HA co-immunoprecipitation. Stable HEK293T cells expressing AML1-CAGEN and CAGEC-ETO constructs were treated with DMSO or rapalog (100 nM) for 18 hours. Nuclei were isolated and an anti-HA co-immunoprecipitation performed. Proteins known to interact with the native AML1/ETO fusion were probed using the indicted antibodies. H4 serves as a negative control. f, Quantitative proteomics analysis of co-enriched proteins following anti-HA immunoprecipitation from nuclei isolated from stable HEK293T cells expressing AML1-CAGEN and CAGEC-ETO constructs and treated with DMSO or rapalog. The green box in the waterfall plot indicates the top 20% of enrichment following the induction of PTS. All data points represent the mean ratios (n=2, biological replicate runs). Data in (b), (c), and (e) are representative of n=3 independent experiments. In panels (b-f), CAGEN refers to ‘NrdJ-1NCage-FKBP-NES’, and CAGEC refers to ‘NES-FRB-NrdJ-1CCage’.

