
Extended Data Fig. 5 |. Multi-omics validation of the scarless AML1/ETO splice product.
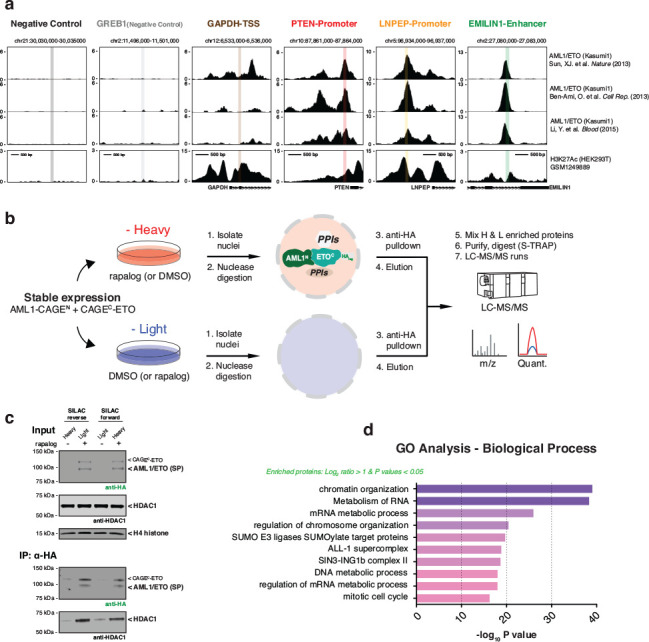
a, Screenshots of ChIP-seq results from three cited references displayed from the UCSC genome browser. Shown are six different regions with associated transcripts. The x-axis represents the genomic positions in base pairs: Negative Control_chr21:30,032,740–30,032,921; GREB1 (Negative Control)_chr2:11,498,624–11,498,837; GAPDH-TSS_chr12:6,534,775–6,534,872; PTEN-Promoter_chr10:87,863,242–87,863,355; LNPEP-Promoter_chr5:96,935,104–96,935,201; EMILIN1-Enhancer_chr2:27,081,454–27,081,577. The first two regions scored negative for AML1/ETO occupancy, and the last four scored positive for AML1/ETO occupancy in patient-derived Kasumi-1 cells. b, Schematic of the quantitative AP-MS workflow using SILAC-labeled HEK293T cells stably expressing AML1-CAGEN and CAGEC-ETO constructs. c, Immunoblots of the abundance of AML1/ETO splice product (HA-tag) and HDAC1 in the SILAC inputs (top) and outputs (bottom). d, Gene Ontology (GO) biological process categories enriched among the proteins in quantitative AP-MS workflow, satisfying average SILAC ratio over two-fold and P-values less than 0.05. Statistical significance was determined by two-way student’s t-tests. CAGEN refers to ‘NrdJ-1NCage-FKBP-NES,’ and CAGEC refers to ‘NES-FRB-NrdJ-1CCage’ in (c).