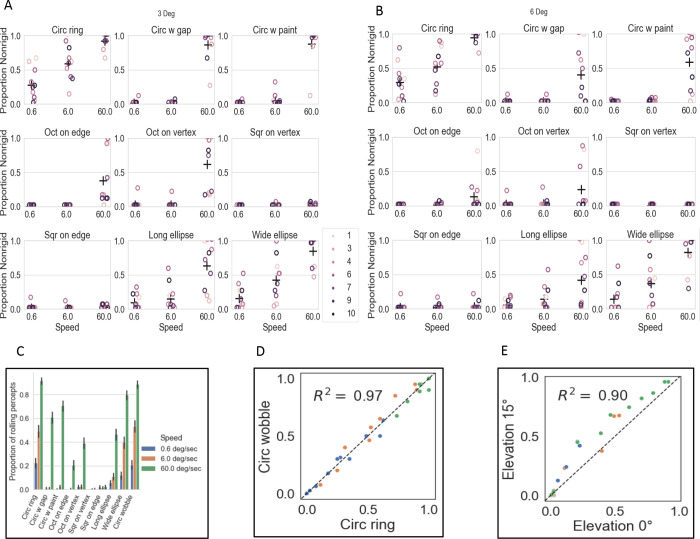
Figure 4. Non-rigid percepts.
Average proportions of reports of non-rigidity for each of 10 observers for each shape at three speeds (0.6, 6.0 & 60.0 dps) for diameters of 3 dva (A) and 6 dva (B). Different colored circles indicate different observers and the average of all the observers is shown by the black cross. (C) Histograms of non-rigid percepts averaged over the 10 observers. The error bar indicates 95% confidence interval after 1000 bootstrap resamples. (D) Average proportion of non-rigid percepts for the rotating and wobbling circular rings for 10 observers and 3 speeds. Similarity is shown by closeness to the unit diagonal and R2 = 0.97. (E) Average proportion of non-rigid percepts for 0° elevation versus 15° elevation. Proportions are similar (R2 = 0.90) , but slightly higher for the 15° elevation.

