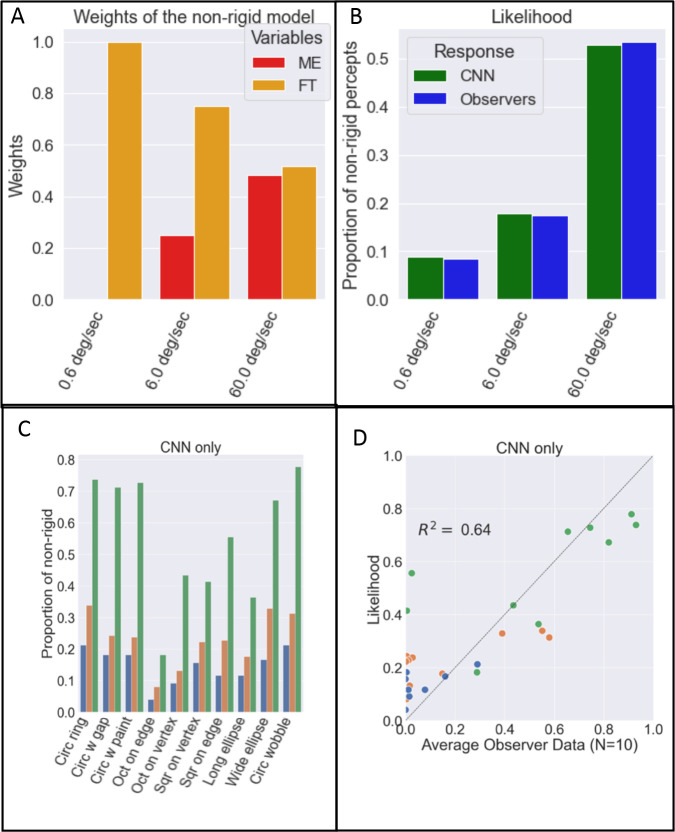
Figure 8. Combining motion-energy and feature tracking outputs.
A: Estimated optimal weights of inputs from the motion energy mechanism (red) and the feature tracking mechanism (yellow) as a function of rotation speed overall shapes. B: CNN rigidity classifications as a function of rotation speed. The trained CNN output from the linear combination of two vector fields, the likelihood, is denoted by the green bar and the blue bar indicates the average of the 10 observers response. C: the proportion of non-rigid percept from the likelihood function of the CNN as a function of the speed of the stimulus for different shapes. Different colors show different speeds of stimulus (blue: 0.6 deg/sec, orange: 6.0 deg/sec, and green: 60.0 deg/sec). D: the likelihood of non-rigidity output plotted against average of observers’ reports. At the fast speed, the model predicts similar probability of non-rigidity for shapes where the observers’ percepts vary. Thus, the model doesn’t capture the important properties of observer’s percepts as a function of the shape of the object.

