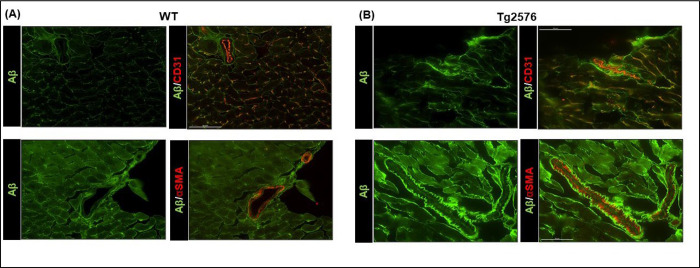
Figure 3: Aβ aggregates surround cardiac vessels and infiltrate the vascular basal lamina.
Top panels: Representative digital images (scale bar 50μm) showing endothelial cells (stained with CD31, in orange) and Aβ (in green). Bottom panels: representative digital images (scale bar 50μm) showing smooth muscle cells by α-Smooth muscle alpha-actin staining (αSMA, in red) and Aβ (in green) in cardiac sections from WT and Tg2576 mice. n=3– 4 mice/group. WT mice are represented in the left panels and Tg2576 mice in the right panels.

