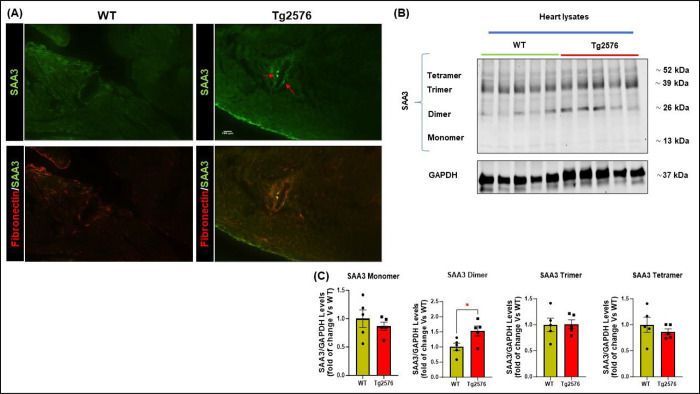
Figure 4: Serum amyloid A3 (SAA3) perivascular deposition in the heart of Tg2576 mice.
(A): Representative images of 12-month-old WT and Tg2576 cardiac sections stained with serum amyloid A3 (SAA3, in green) and fibronectin fibers (in red, scale bar 100μm). (B-C): representative immunoblots (top panels) and densitometric quantitative analysis (bottom panels) showing the levels of different aggregates of SAA3 in total cardiac lysates from WT and Tg2576 mice. GAPDH levels were used as a loading control. n= 5 mice/group. Data are presented as a mean±SEM. *P<0.05 and vs WT. Student t-tests have been performed between the 2 groups.

