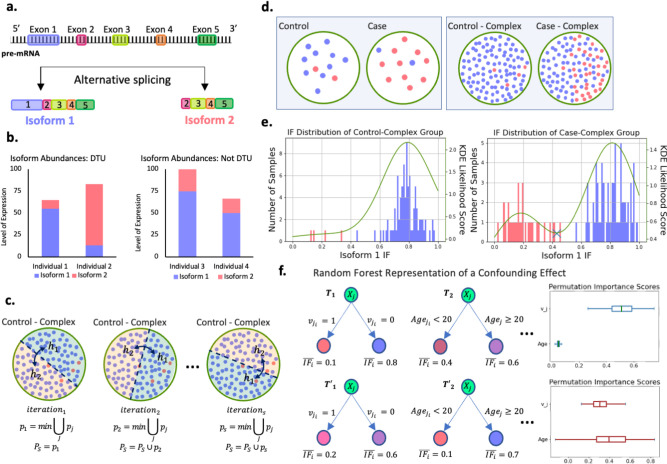
Figure 1: DTU detection demonstration.
a. Gene locus going though alternative splicing to produce Isoform 1 and Isoform 2. b. Left panel: Isoform abundances in a sample case of DTU between individuals 1 and 2. Right panel: Isoform abundances in a sample case without DTU but with changes in overall expression between individuals 3 and 4. c. Three SPIT-Test iterations demonstrated with random splits of the Control-Complex group. Samples (dots) are color coded based on their dominant isoforms for the locus in c-f, with blue=isoform 1 and red=isoform 2. d. Left panel: Conventional DTU analysis assumption with no structured heterogeneity in either group. Right panel: Heterogeneity structure in complex disease samples, where a subset of cases share the same genetic abnormality (Case-Complex). e. Corresponding isoform fraction (IF) distributions for the samples represented in groups Control-Complex and Case-Complex. f. Random forest regression representation when there is not a significant confounding effect in the DTU transcript (Upper panel) vs. when there is a clear confounding effect by the covariate “age” (Lower panel). Corresponding permutation importance scores for age and are shown on the right.

