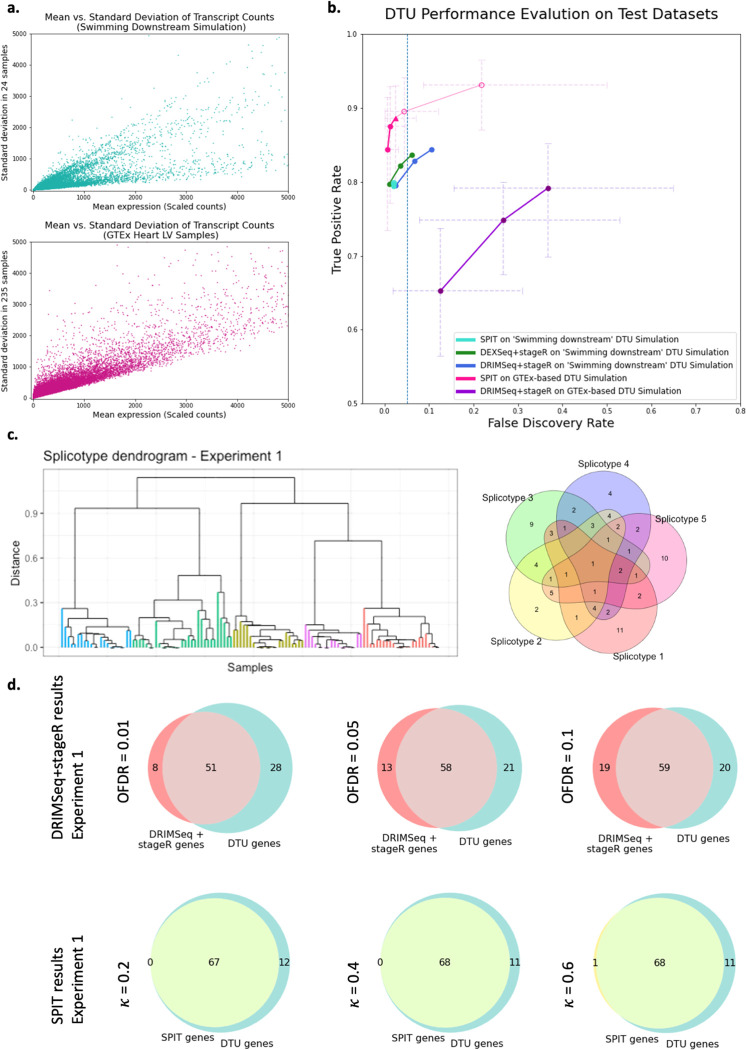
Figure 2:
a. Mean vs. standard deviation of the transcript counts are plotted for the Swimming Downstream and GTEx experiment samples to represent relative dispersion levels. b. Gene-level DTU-performance evaluation on both Swimming Downstream and GTEx test datasets. Radical values of and are included (as unfilled circles) to show the effects of hyperparameter adjustment. c. The DTU event sharing Venn diagram for the first experiment in the GTEx simulations (Right), and the corresponding final subcluster dendrogram based on the SPIT DTU matrix (Left). The subclusters are color coded based on their distinct sets of simulated DTU events (splicotypes). d. Overlap of DRIMSeq+stageR pipeline (Top) and SPIT (Bottom) results with simulated DTU genes in the first experiment.

