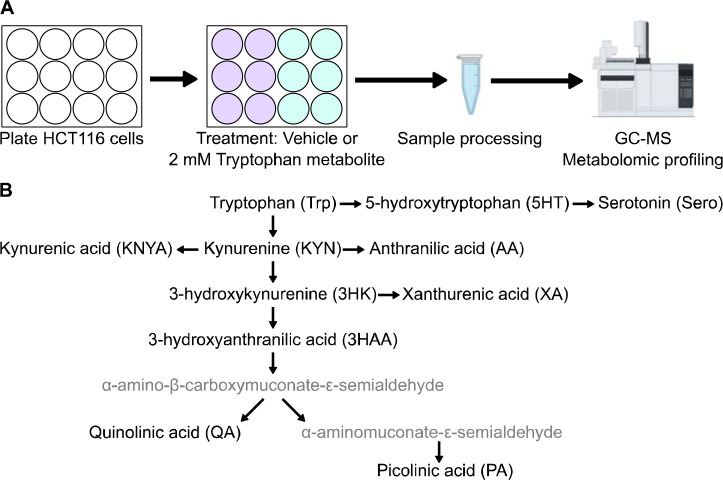
Figure 2.
A) Experimental design for metabolic profiling. HCT116 cells were treated with tryptophan metabolites and analyzed via gas chromatography mass spectrometry (GC-MS). B) Diagram of tryptophan metabolism and metabolites tested in the experiment (black font, abbreviations shown in parentheses).

