Figure 3.
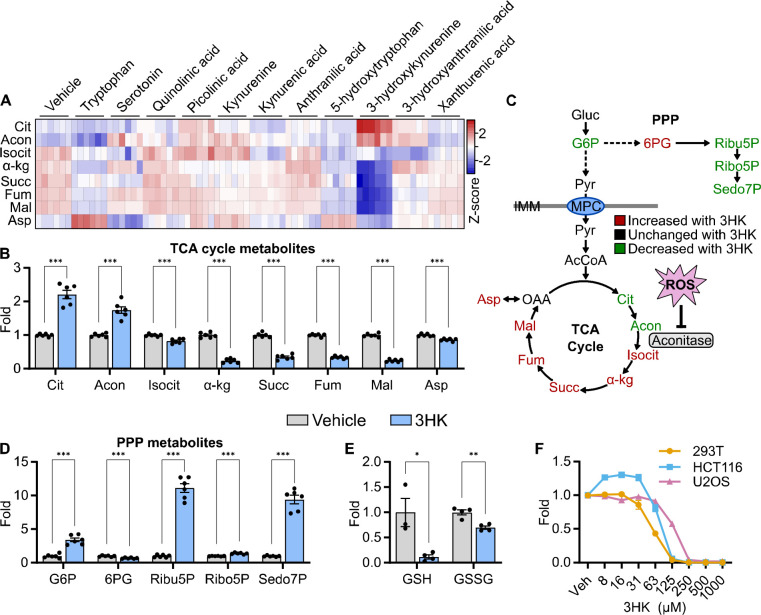
A) Heat map showing the Log2 fold change of TCA cycle intermediates in HCT116 cells following tryptophan metabolite treatment for 6 hours (n = 6). B) Bar graphs showing relative fold changes of TCA cycle intermediates in HCT116 cells treated with 3HK (2 mM) for 6 hours (n = 6, statistical analysis by Student’s t-test compared to Vehicle). C) Schematic showing TCA cycle and pentose phosphate pathway (PPP) metabolites color-coded based on their direction of change following treatment with 3HK (2 mM) for 6 hours. D) Relative fold changes of PPP intermediates in HCT116 cells treated with 3HK (2 mM) for 6 hours (n = 6, statistical analysis by Student’s t-test compared to Vehicle). E) Bar graphs showing reduced (GSH) and oxidized glutathione (GSSG) in HCT116 cells treated with 3HK (2 mM) for 6 hours. (n = 3–4, statistical analysis by Student’s t-test compared to Vehicle). F) Line graph showing cell viability in three cell lines (293T, HCT116, U2OS) treated with 3HK at the concentrations indicated after 48 hours of treatment (n = 3–4). Data shown as mean ± SEM. * p < 0.05, ** p < 0.01, ***p < 0.001. Abbreviations: Gluc, glucose; G6P, glucose 6-phosphate; Ribu5P, ribulose 5-phosphate; Ribo5P, ribose 5-phosphate; Sedo7P, sedoheptulose 7-phosphate; Pyr, pyruvate; AcCoA, acetyl-CoA; Cit, citrate; Acon, aconitate; Isocit, isocitrate; α-kg, α-ketoglutarate; Succ, succinate; Fum, fumarate; Mal, malate; OAA, oxaloacetate; Asp, aspartate; ROS, reactive oxygen species; IMM, inner mitochondrial membrane.

