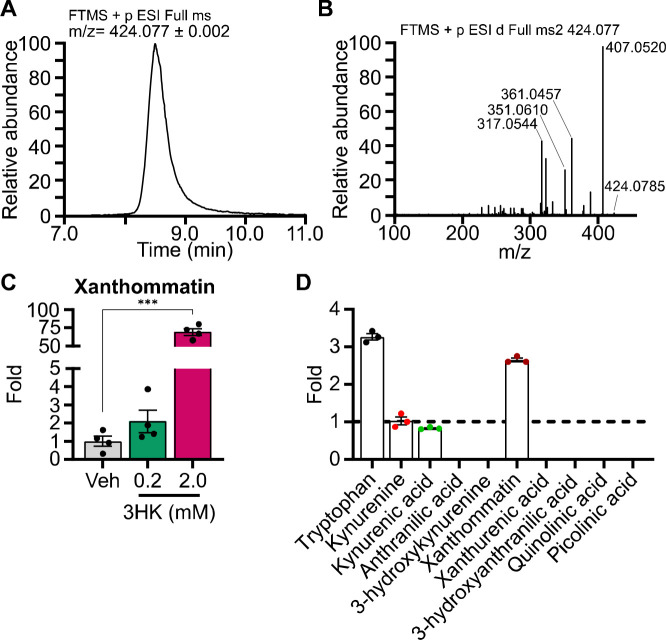
Figure 5.
A) Line graph showing the extracted ion chromatogram of xanthommatin [M+H] molecular ion (424.077 m/z) viewed with a 2 milli mass unit tolerance. B) Line graph showing the xanthommatin molecular ion MS/MS mass spectra collected with a higher-energy collision dissociation (HCD) energy of 40%. C) Bar graph showing the relative fold xanthommatin levels in HCT116 cells treated with 3HK at the specified dosages for 6 hours (n = 4, statistical analysis by one-way ANOVA with Holm-Sidak post-hock comparison compared to vehicle treatment (Veh)). D) Bar graph showing relative fold xanthommatin levels in HCT116 treated with IFN-γ (50 ng/μL) for 24 hours and subsequent 1 mM tryptophan treatment for 6 hours compared to vehicle (dotted line). (n = 3, nd = not detected). Data shown as mean ± SEM. ***p < 0.001.

