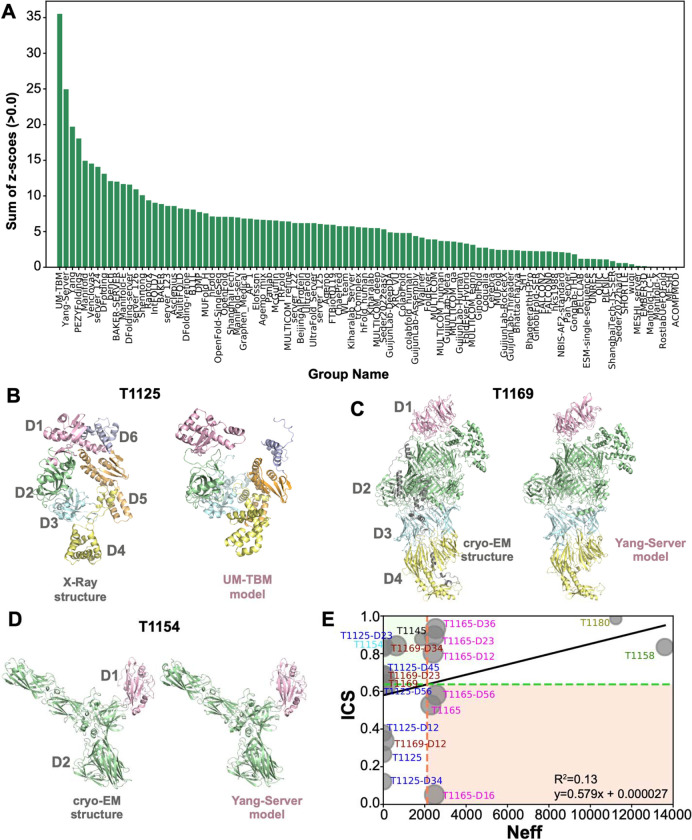
Figure 7.
A. Performance of CASP15 groups in predicting interfaces of multi-domain targets. The groups are ranked according to their first submitted models with the Z-score function given in Eq. 5. B. The domain organization of T1125. The top-ranking model generated for this target is submitted by UM-TBM. In this model, D6 is not closing upon D1, as in the crystal structure. C. The domain organization of T1165. The top-ranking model generated for this target is submitted by Yang-server. In this model, D1 is not closing upon D2, as in the cryo-EM structure. D. The domain organization of T1154. The top-ranking model generated for this target is submitted by Yang-server. E. Relationship between the baseline Neff values and the best ICS values generated for the interdomain category. The horizontal green dotted line represents the mean best-ICS value (0.64), and the vertical red dotted line represents the mean Neff value (2117). The green zone represents the area where lower Neff values are associated with higher ICS values, while the red zone represents the area where higher Neff values are associated with lower ICS values. The interdomain targets from the same structure are colored uniformly. Data point markers are scaled to their assembly size with larger complexes shown as larger circles. The depicted Neff data are tabulated in Table 6.

