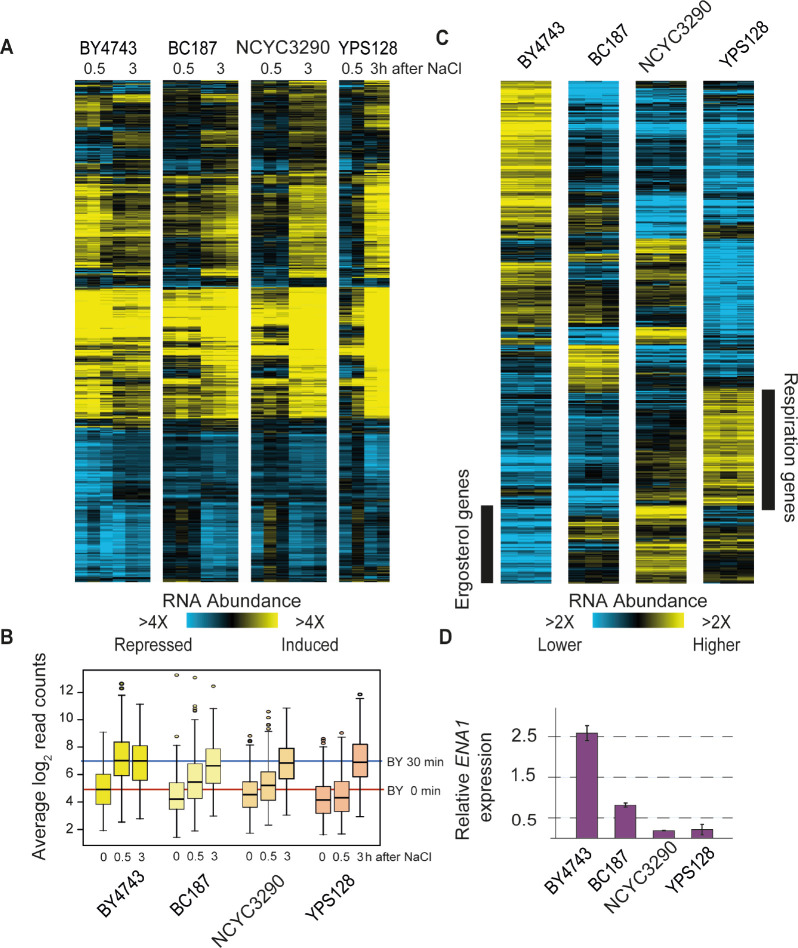
Figure 4. Gene expression differences implicate strain-specific physiology.
A) Hierarchical clustering of 1,141 genes whose log2(fold change) in response to NaCl was different from the mean in at least one of the four strains (FDR < 0.05). As shown for Figure 2, except that here values represent relative mRNA abundance in stressed samples versus the prestressed sample from that strain. Each column represents one of three biological replicates (or two in the case of YPS128). B) The distribution of log2 normalized read counts for genes induced in the ESR across strains and time points. The median abundance of genes in the laboratory strain before and at 30 min after NaCl treatment is indicated with red and blue lines. C) Hierarchical clustering of 608 genes whose basal expression before NaCl is different from the mean in at least one of the four strains (FDR < 0.05). Each column is one of three biological replicates of cells growing in rich medium in the absence of stress, where log2 values represent expression relative to the mean of all strains according to the key. D) Average and standard deviation of ENA1 expression in the absence of stress relative to the mean of all strains.

