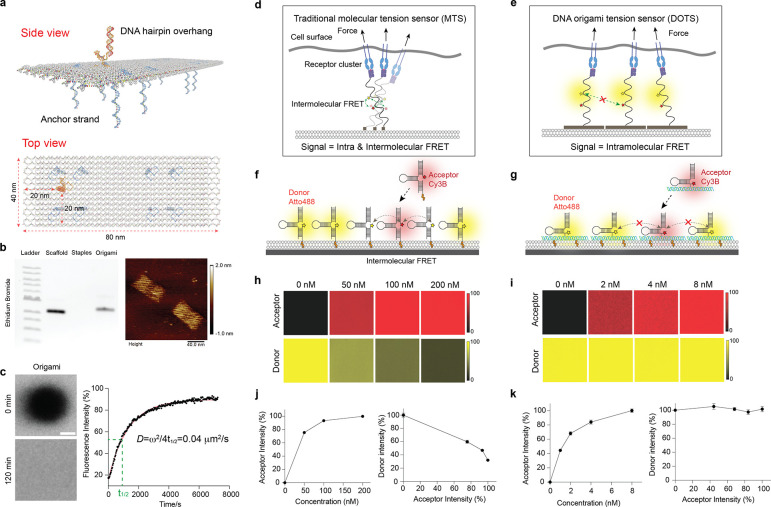
Figure 1. Characterization of DOTS.
a Schematic of DOTS comprised of a rectangular nanosheet that presents a single hairpin on one face and eight anchor strands on the other face for anchoring DOTS to membrane. b Left: agarose gel electrophoresis showing the bands of DNA origami scaffold, staples, and annealed DOTS. Right: liquid AFM image of DOTS. c FRAP of DOTS on the DOPC SLB surface. Left: fluorescence images showing the fluorescence recovery of the photobleached area after 120 min. Right: FRAP curve with a recovery half time t1/2 of 910 seconds. Scale bar=10 μm d Schematic showing intermolecular FRET between adjacent MTS at high molecular density. e Schematic showing the dimension of DOTS prevents crosstalk between fluorophores, thus eliminating the intermolecular FRET. f-g Schematic showing the process of adding of acceptor fluorophore tagged MTS/DOTS to SLBs that were precoated with donor tagged MTS/DOTS. h Representative fluorescence images showing MTS acceptor (Cy3B) fluorescence signals on the SLB surface under different incubation concentrations. The MTS donor (Atto488) fluorescence intensity decreased after addition of acceptor MTS. i Representative fluorescence images showing DOTS acceptor fluorescence signals on the SLB surface under different incubation concentrations. The donor fluorescence intensity remained constant regardless of the density of the acceptor. j-k Plot showing the correlation between the fluorescence intensities of donor and acceptor MTS (j) or DOTS (k) on the SLB surface.

