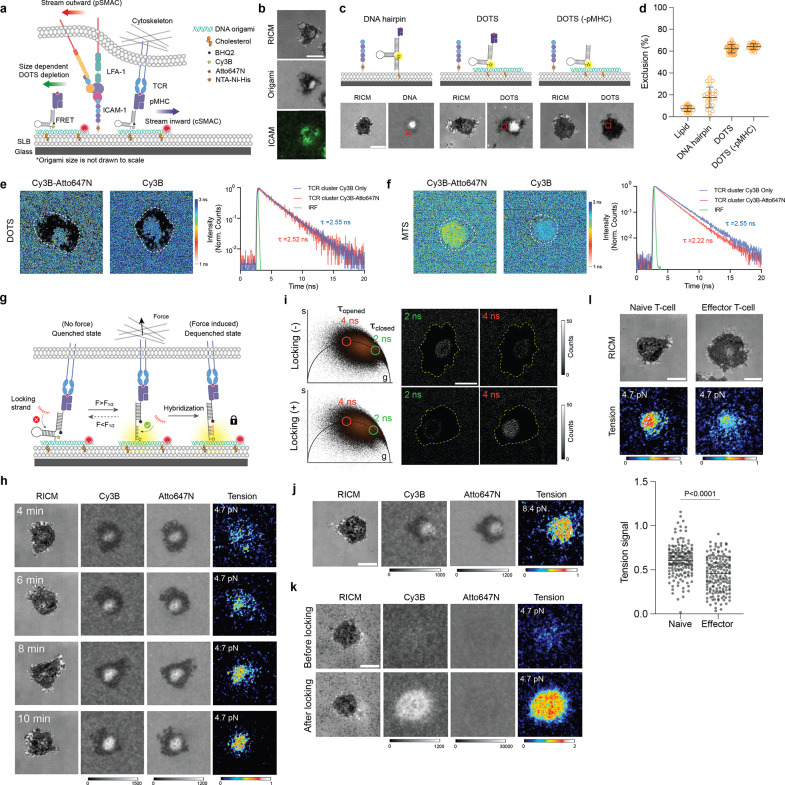
Figure 2. TCRs transmit mechanical force to laterally fluid antigen.
a Schematic of functionalized SLB. Upon T cell spreading, free DOTS, TCR engaged DOTS and LFA-1-ICAM underwent reorganization at the T cell-SLB junction. b Representative microscope images showing the signal of T cell, DOTS and ICAM-1-GFP on the DOPC SLB surface. c Schematic and representative images showing different exclusions of DNA structures (hairpin, DOTS, DOTS lacking pMHC antigen) from the T cell spreading area d Plot comparing the exclusion levels of different DNA structures. The level of exclusion was quantified by measuring the decrease in DNA fluorescence intensity within the cell spreading area (ROIs indicated by red squares in panel (c)). n>23 cells for each condition. e Representative FLIM images of Cy3B fluorophore on the SLB surface functionalized with Atto647-DOTS and Cy3B-DOTS or Cy3B-DOTS alone. White dash lines indicate theT cell spreading areas. Black pixels in the lifetime image indicate pixels with <25 photons or lifetime > 3.2 ns (Supplementary note 1). FLIM decay curves of pixels at TCR clusters formed on Atto647/Cy3B-DOTS SLB or Cy3B-DOTS only SLB. Averaged lifetimes of pixels were noted next to the curves. f Representative FLIM images of Cy3B fluorophore on the SLB surface functionalized with Atto647-MTS and Cy3B-MTS or Cy3B-MTS alone. Black pixels in the lifetime image indicate pixels with <25 photons or lifetime > 3.1 ns. FLIM decay curves of pixels at TCR clusters with averaged lifetime noted. g Schematic showing that locking strand hybridizes to mechanically opened DNA hairpin to capture transient TCR force events. h Time lapse images showing the dynamics of 4.7 pN TCR tension signal in the immune synapse. i Comparison of τclosed and τopen population before and after adding locking strand. The pixel images of specific lifetime were obtained by back-projection of the points within the green circles (τclosed population) and red circles (τclosed population) in the phasor plots. j Representative RICM and tension images (8.4 pN) of T cell cultured on fluid DOPC SLB. k Representative images of 4.7 pN TCR tension on non-fluid DPPC SLB. l Representative images showing TCR tension signal of naïve and effector T cell after 20 min spreading on DOPC fluid SLB. Dot plot comparing the tension signals of naïve T cells and effector T cells. n>170 cells from 3 independent experiments. Scale bars = 5 μm

