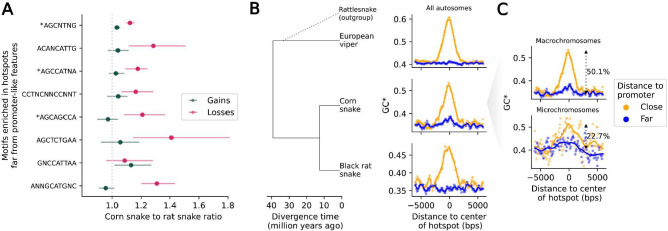
Figure 3: Footprints of recombination in divergence data.
A) The ratio of losses in the corn snake lineage relative to the black rat snake (in magenta) and the ratio of gains in the corn snake lineage relative to the black rat snake (in green), for motifs enriched in recombination hotspots far from promoter-like features (>10 kb), ordered by motif enrichment significance (top to bottom). The 95% confidence intervals are obtained by bootstrapping over 5 Mb regions with at least one gain or loss event in either of the two lineages. B) Increased flux to GC (GC*) as a function of distance from corn snake autosomal hotspots, in sliding windows of 500 bp with a 100 bp offset, for the lineages leading to European viper (top), corn snake (middle) and black rat snake (bottom). Note that rattlesnakes, a sister species to European viper, were included only to infer the ancestral state in substitutions (see Methods). GC* around hotspots that are close (<500 bp) to a promoter-like feature (orange) and far from any promoter-like feature (blue) are shown. Local regression curves are shown for a span of 0.05. C) GC* in the lineage leading to corn snakes, for hotspots in macro- (top) and microchromosomes (bottom), using the same color scheme as in B. Local regression curves are shown for a span of 0.05 and 0.2 in macro- and microchromosomes, respectively. The percentage increase in the mean GC* for sites >3 kb away from the center of the hotspot relative to that within 200 bps of the center are shown.

