
FIGURE 7.
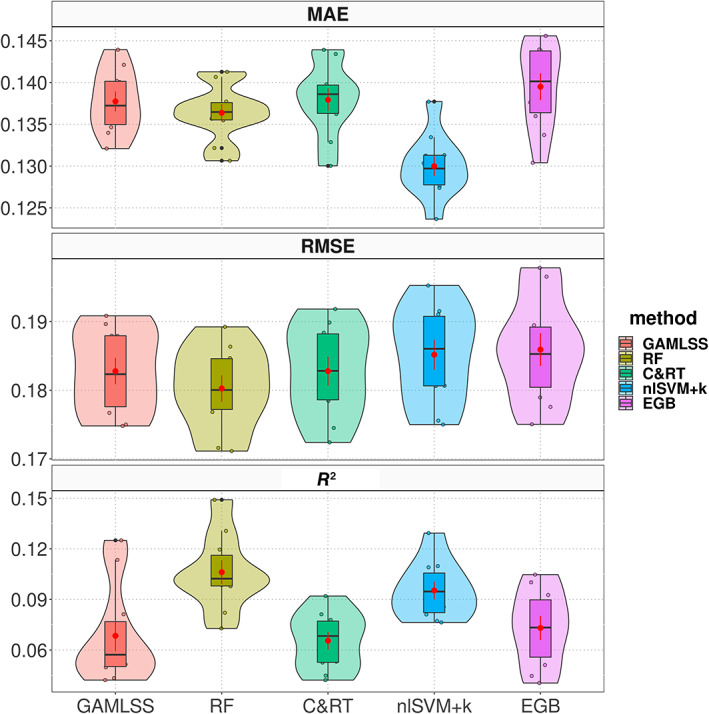
Violinplots of the cross‐validation results. The mean and its 95% confidence interval (CI) are represented by the red dots and error bars. The overlaid dot plots, on each violin plot, represent the result of each of the 10‐fold cross‐validation.