
Fig. 3.
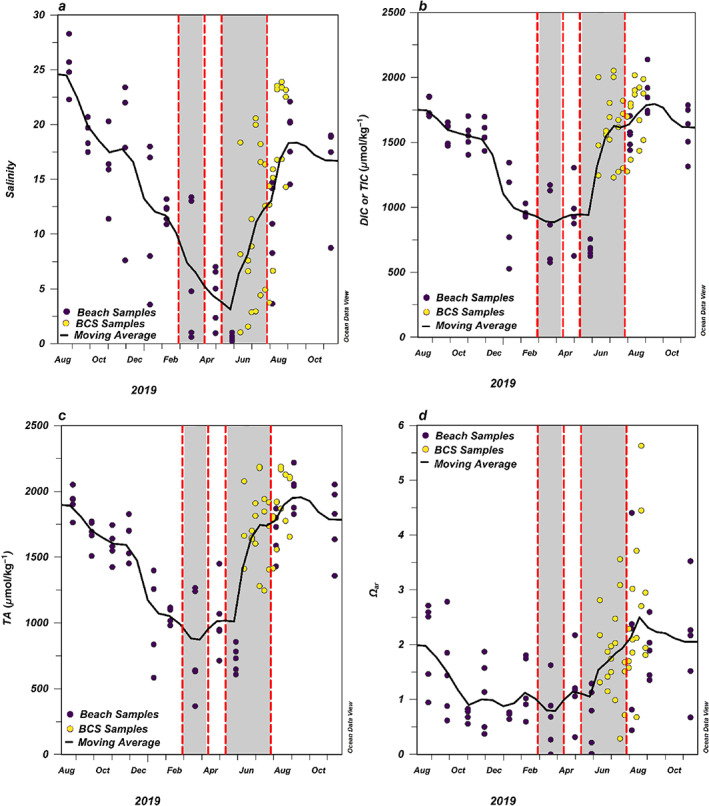
(a) Salinity, (b) DIC (for BCH samples) or TIC (for BCS samples) (μmol kg−1), (c) TA (μmol kg−1) and (d) Ωar measured from monthly BCH samples (purple circles) and coastal BCS Stas. 3, 6, and 9 (yellow circles) from August 2018 to November 2019. Black lines indicate the moving monthly average across stations (BCH and BCS) throughout the year. The gray shaded areas bordered by red dashed lines indicate when the BCS was open during summer 2019.