
Fig. 6.
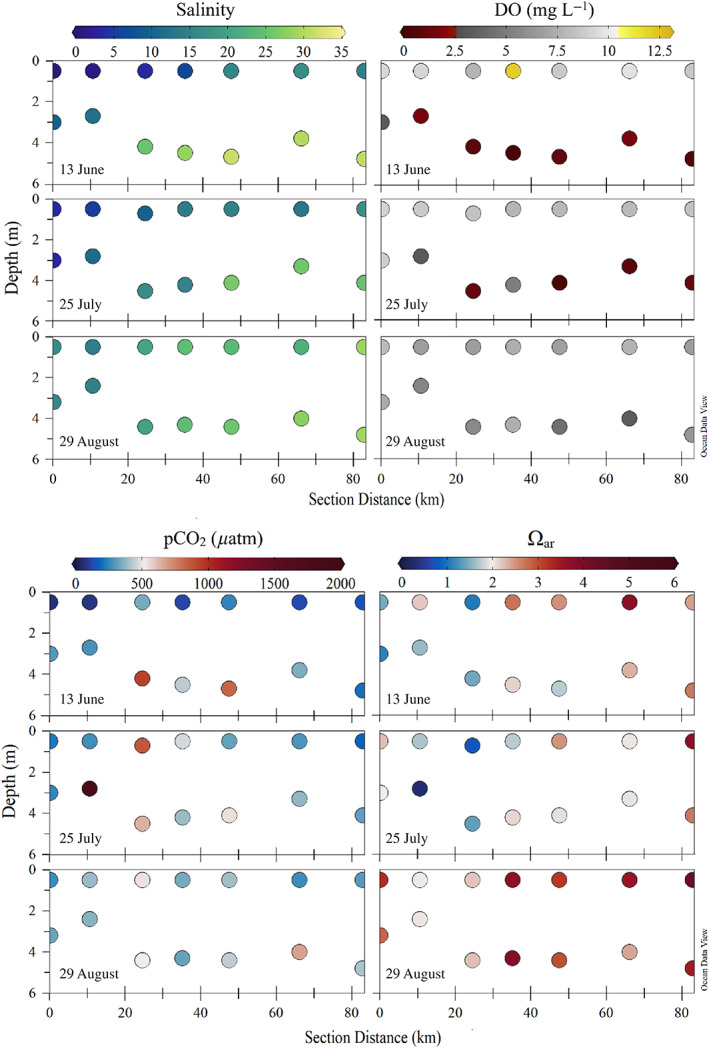
Horizontal transect through the middle Sound, including BCS Stas. 2, 3, 4, 7, 10, 13, and 16 (see Fig. 1 for locations). Red star indicates where the transect begins (section distance = 0). Salinity (top left panels), DO (mg L−1; top right panels), pCO2 (μatm; bottom left panels), and Ωar (bottom right panels) for surface and subsurface samples as a function of distance along the section are shown for the sampling dates 13 June, 25 July, and 29 August.