
Figure 7.
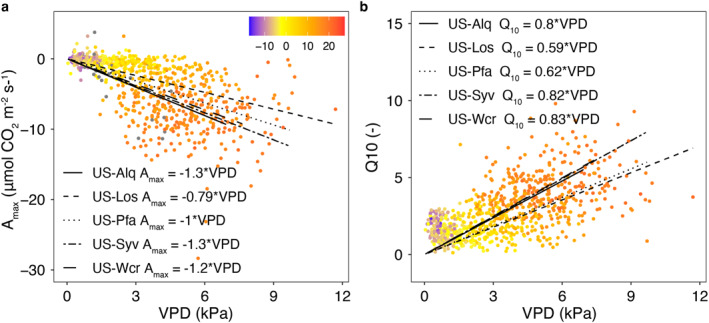
Relationship of monthly (a) the photosynthetic maximum assimilation parameter (A max) and (b) the respiration temperature sensitivity parameter (Q 10) to Vapor pressure deficit (VPD, x‐axis) and temperature (color) for the five tower sites, including best fit lines for each site.