
FIGURE 4.
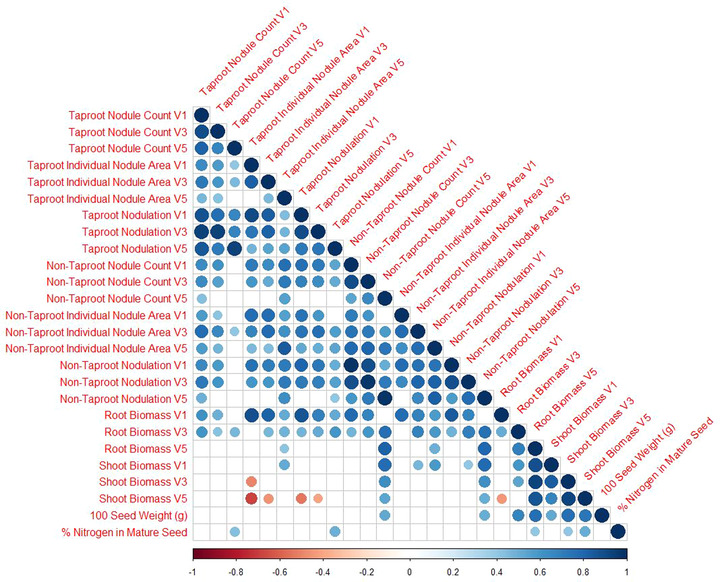
Spearman correlation of significant (α > .1) trait correlations for nodule traits. Data comes from six soybean genotypes grown in 10 to 12 replications in each of the three environments
Official websites use .gov
A
.gov website belongs to an official
government organization in the United States.
Secure .gov websites use HTTPS
A lock (
) or https:// means you've safely
connected to the .gov website. Share sensitive
information only on official, secure websites.
Spearman correlation of significant (α > .1) trait correlations for nodule traits. Data comes from six soybean genotypes grown in 10 to 12 replications in each of the three environments