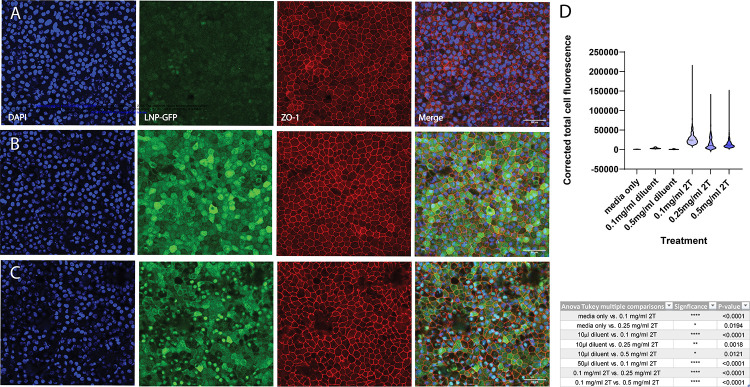
Figure 7. EGFP mRNA transfects human fRPE in vitro.
Human fRPE cells treated with EGFP mRNA encapsulated in 2TLNPs for 2 hours express EGFP. (A) fRPE cells treated with diluent only (same volume as (B)) have minimal EGFP expression. (B) Cells were treated with 0.1 mg/mL mRNA LNP and have higher GFP expression than those treated with diluent only. (C) fRPE cells treated with 0.5 mg/mL mRNA LNP also have EGFP expression higher than (A) and additionally have nuclear EGFP expression. Images shown are representative of at least 3 cell culture wells and are MIPs (scale bar: 50 μM). (D) EGFP expression was quantified and plotted in a violin plot as Corrected Total Cell Fluorescence (CTCF). P-values from an ANOVA test with post-hoc Tukey multiple comparisons are shown in the table. CTCF values are significantly higher in LNP-treated cells than in diluent-treated cells.

