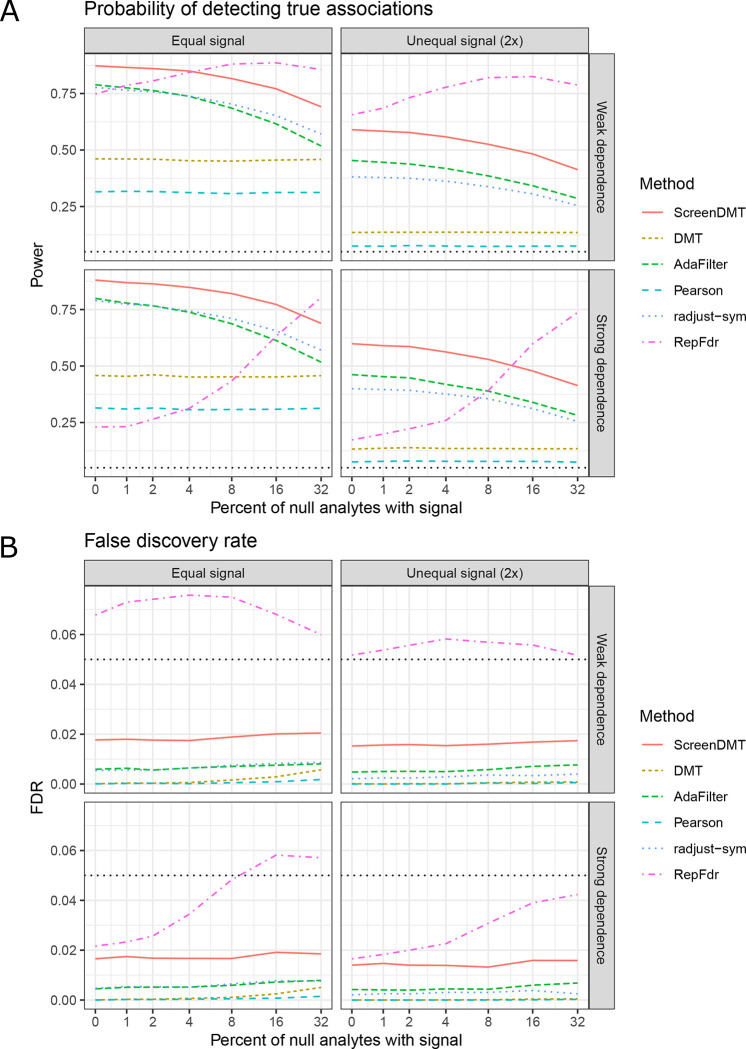
Figure 1. Comparison of ScreenDMT’s power and false discovery rate to competing approaches in replication of two datasets via simulation.
Simulation of two datasets with strong or weak dependence between analytes when the signal strength or effect size per analyte is equal between the two datasets and when it is unequal. The x-axis represents the percent of analytes that do not truly directionally replicate but show some effect in one of the studies or show effect in both studies of opposite direction. (A) Probability of detecting true associations (power). (B) False discovery rate. The FDR threshold is 5%.

