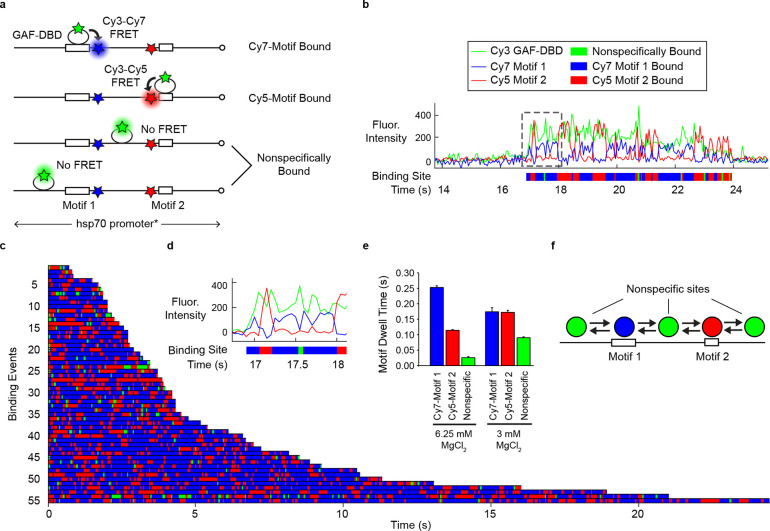
Figure 2.
GAF-DBD explores free DNA by 1-dimensional diffusion. a, 3-color smFRET distinguishes whether GAF-DBD is bound to Cy7-labeled Motif 1, Cy5-labeled Motif 2, or a nonspecific site on the D. melanogaster hsp70 promoter DNA. b, A single-molecule trajectory on a DNA molecule shows GAF-DBD sliding back-and-forth on the DNA between two cognate motifs. Binding location over time is shown below the trajectory as a colored track. c, 55 binding events shown as colored tracks. d, Zoomed-in view of the boxed region in b. e, GAF-DBD dwell times on Motif 1, Motif 2, or a nonspecific site on the DNA at regular (6.25 mM) or low (3 mM) MgCl2 concentration. f, Schematic of GAF-DBD sliding on DNA. Circles represent GAF-DBD. Green circles indicate GAF-DBD binding to a nonspecific site; the blue circle indicates binding to Motif 1; the red circle indicates binding to Motif 2.

