
Extended Data Figure 6.
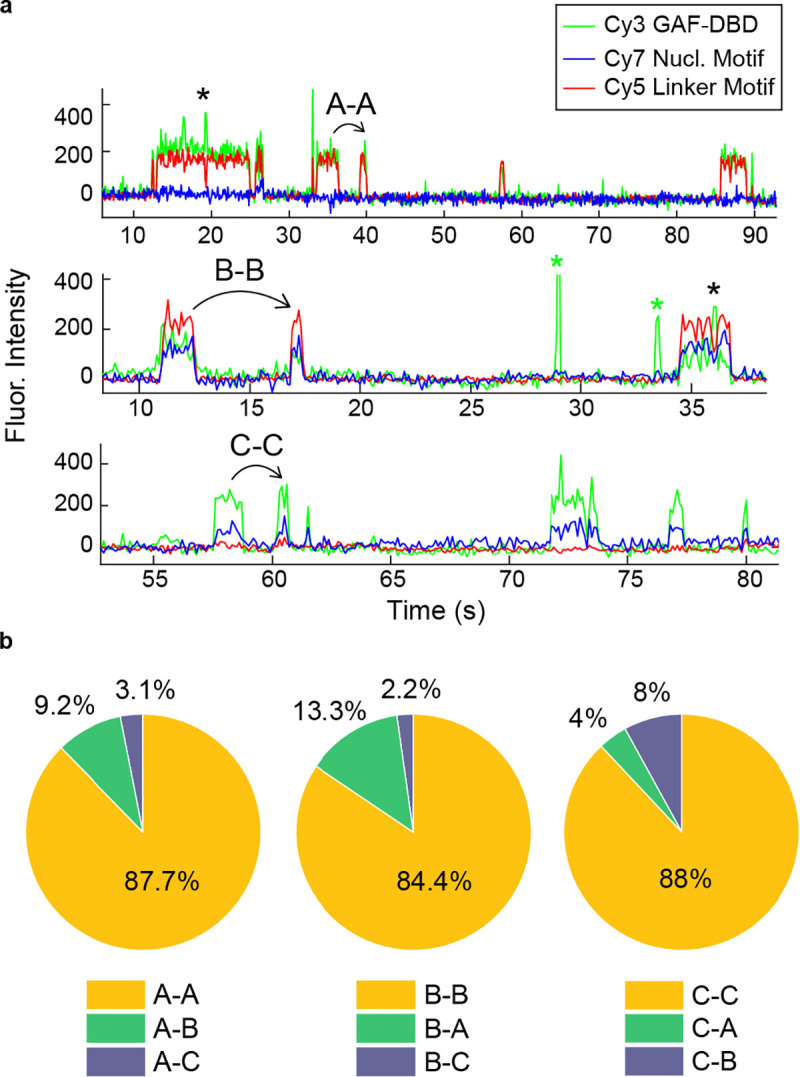
GAF-DBD preferentially re-visits the same cognate site on individual hsp70 nucleosomes. a, Representative single-molecule trajectories showing repetitive visits to the same binding site on a single nucleosome. Upper trace shows repetitive visits to binding site A; middle trace, site B; lower trace, site C. Black asterisks mark transient Cy3 only fluorescence within a binding event, potentially caused by ultra-short-range 1D diffusion on the nucleosome. Green asterisks indicate binding events to non-cognate sites on the nucleosome. b, Pie charts showing for all binding events at site A (left pie chart, N = 65), B (middle, N = 45) or C (right, N = 25), the fraction of events that were followed by a second binding to site A, B or C.