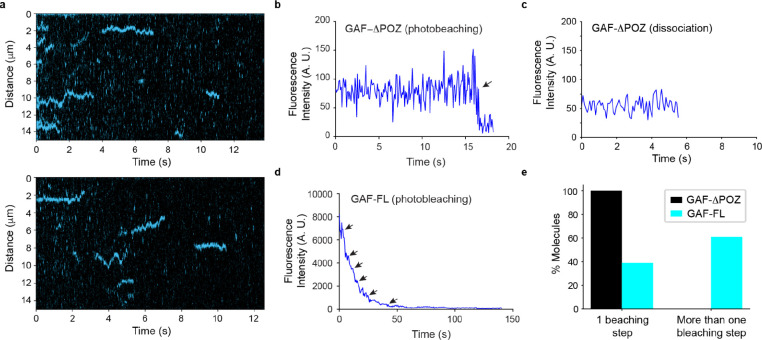
Extended Data Figure 9. Behavior of full-length GAF depends on multimerization by POZ domain.
a, Representative kymographs show AF546-GAF-ΔPOZ binding to DNA over time on + hsp70 DNA. b, Representative fluorescence intensity versus time plot for a single trace showing GAF-ΔPOZ photobleaching (indicated by an arrow). c, Representative trace showing GAF-ΔPOZ dissociation (at ~ 5.7 s). Note the abrupt loss of fluorescence signal in this case, which is distinguishable from photobleaching, shown in b, where fluorescence decreases to a near-zero but detectable level. d, Representative trace showing GAF-FL photobleaching. Arrows indicate stepwise photobleaching. e, Fraction of GAF-ΔPOZ (N=100) and GAF-FL (N=200) molecules with 1 or multiple photobleaching steps.

