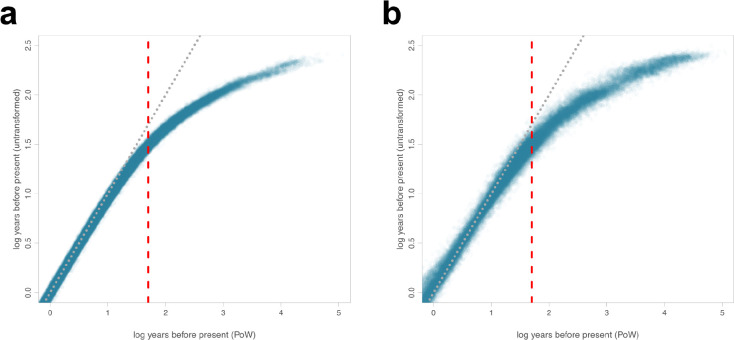
Extended Data Fig. 7. Prisoner of War (PoW) transformation comparison.
The log number of years of each internal node before the most recently sampled taxon compared to the log number of years of the same node after applying a PoW transformation for (a) 100 SARS-CoV-1-like posterior phylogenies for each NRR and (b) 100 SARS-CoV-2-like posterior phylogenies for each NRR. Red dashed line at 50 years before the most recently sampled taxon indicates a threshold beyond which saturation effects substantially influence tMRCA estimates. Diagonal dotted line depicts a line of equality, with a one-to-one correspondence between the two inferences on the two axes.

