
Figure 2. Nanobody epitope groups and mAb epitope classes mapped on RBD.
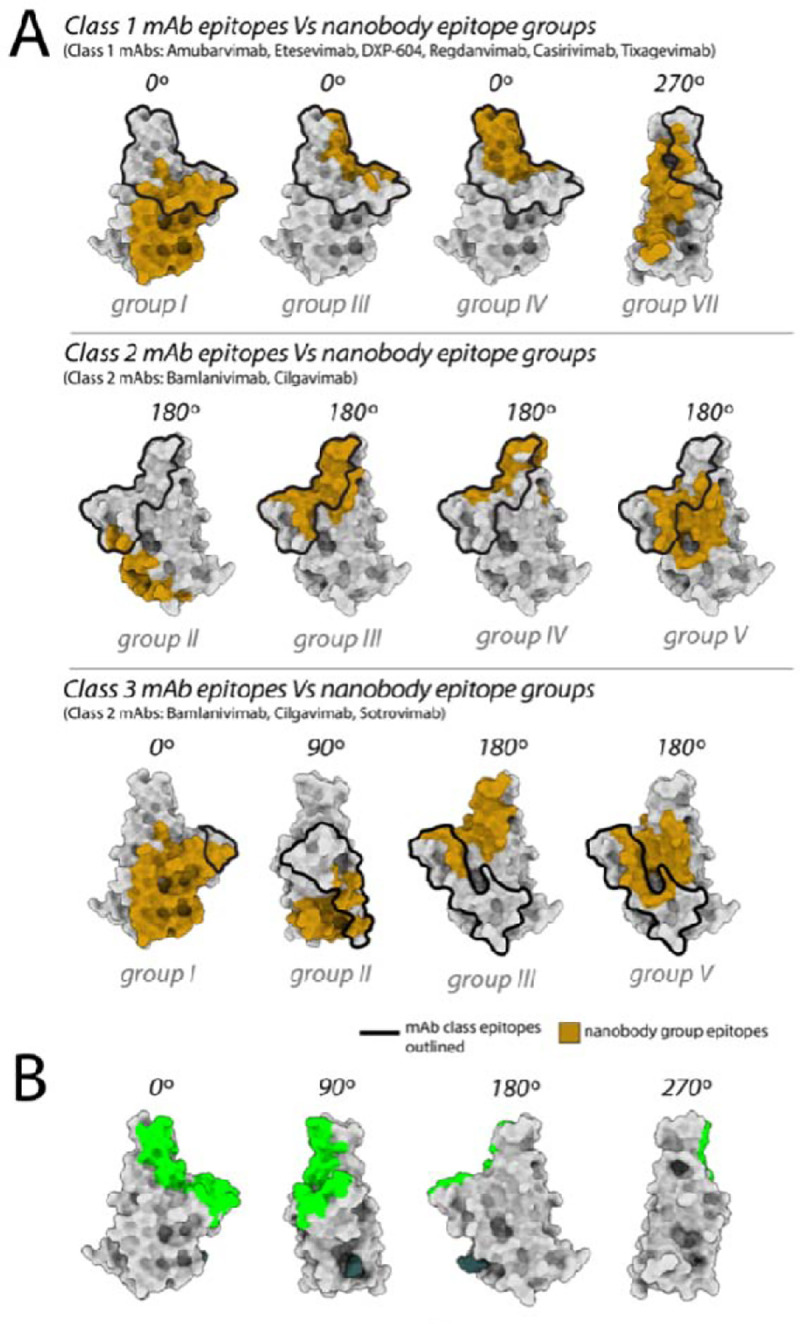
(A) Nanobody epitope groups overlapping with the three mAb epitope classes (class 1, class 2 and class 3). Nanobody groups are highlighted in gold, while mAb class footprints are outlined in black. mAb epitopes are taken from Cox et al (Cox, Peacock et al.). (B) A single RBD subunit with the ACE2 footprint/RBM mapped in green. All epitopes are represented on the structure of wild-type RBD (PDB ID: 6M0J). All structure representations were generated using ChimeraX (Pettersen, Goddard et al.).