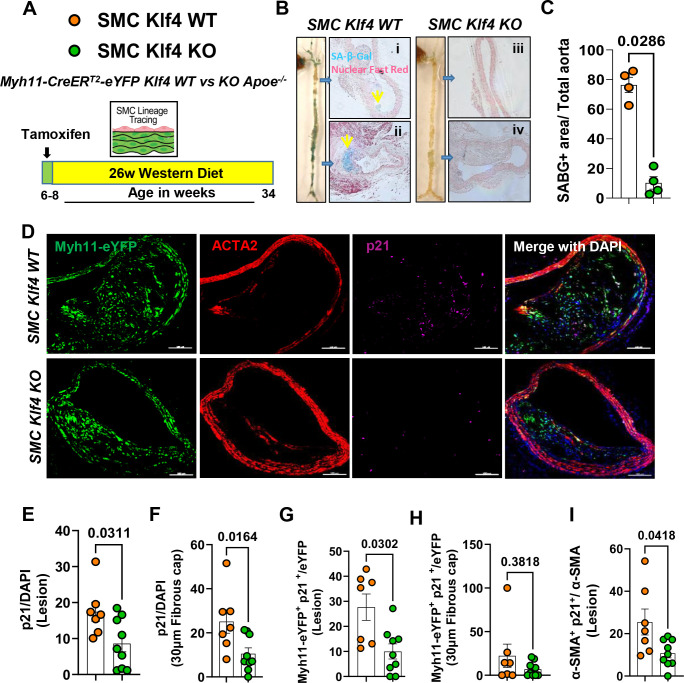
Figure 1. SMC-Klf4 KO resulted in a marked reduction in overall lesion senescence including reduced expression of the pro-senescence markers p21, p16, and SAβG, but preserved anti-senescence marker telomerase reverse transcriptase positive cells.
(A) Experimental design, SMC ((Myh11-CreERT2-eYFP)) lineage tracing Klf4 WT vs KO Apoe−/− mice were injected with tamoxifen at 6 to 8 weeks of age and subsequently placed on Western diet (WD) for 26 weeks to induce advanced atherosclerosis. (B) SAβG staining was performed as described in the methods section on freshly isolated aortas. (Bi-iv) thoracic and abdominal aortic sections from SAβG stained aortas from B and counter stained with nuclear fast red. (C) Quantification of SAβG+ area of the aorta. (D) Representative images of co-staining for eYFP (for detecting SMC), α-SMA, p21 (a marker of senescence) and DAPI (nucleus) in advanced BCA lesions from SMC Klf4 WT and KO animals fed a WD for 26 weeks. The confocal images show a maximum intensity projection ×20 zoom with a scale bar of 100μm. Quantification of the frequency of p21+ (p21+/DAPI) senescent cells in the lesion (E) and fibrous cap (F) as a percent of total cells in the lesions. Quantification of SMC derived p21+ (eYFP+ p21+/eYFP) senescent cells in the lesion (G) and the fibrous cap (H) as a percent of total SMC. Quantification of α-SMA+ senescent (α-SMA+ p21+/ α-SMA) cells in the lesion (I) as a percentage of total α-SMA+ cells. Mann-Whitney U-tests were used in C, and E-I. The error bars show the standard error of the mean (SEM). Independent animals are indicated as individual dots (WT, n=7, and KO, n=9). The p-values are indicated on the respective graphs.

