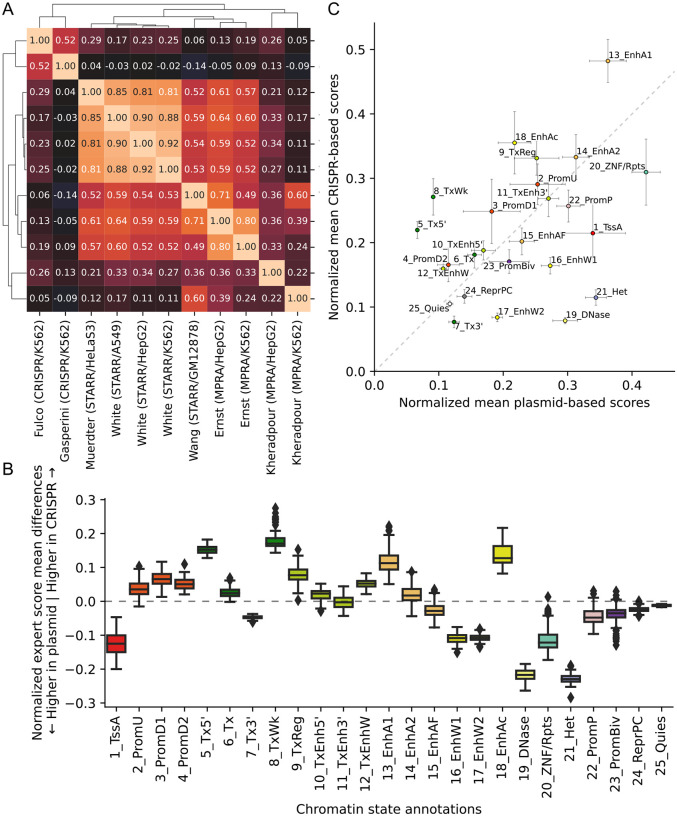
Figure 2: Correlation of individual expert scores and comparison of plasmid-based and CRISPR-based experts.
(A) Heatmap of mean genomewide Pearson correlations between expert model tracks clustered with hierarchical clustering, averaged over cell types. (B) Box plots of mean normalized score differences across cell types between experts trained on 9 plasmid-based and 2 CRISPR-based functional characterization datasets in different ChromHMM chromatin states [13, 39]. The boxes represent quartiles and whiskers indicate maximum and minimum score differences between plasmid-based and CRISPR-based experts. Individual mean scores averaged across cell types, for each expert separately, is shown in Supplementary Figure S5. The corresponding box plot distributions of means across cell types for each expert and each state is shown in Supplementary Figure S6. (C) Scatter plot of mean normalized expert scores for plasmid-based vs. CRISPR-based functional characterization datasets per chromatin state, averaged over cell types. Error bars indicate standard deviation of score means across cell types.

