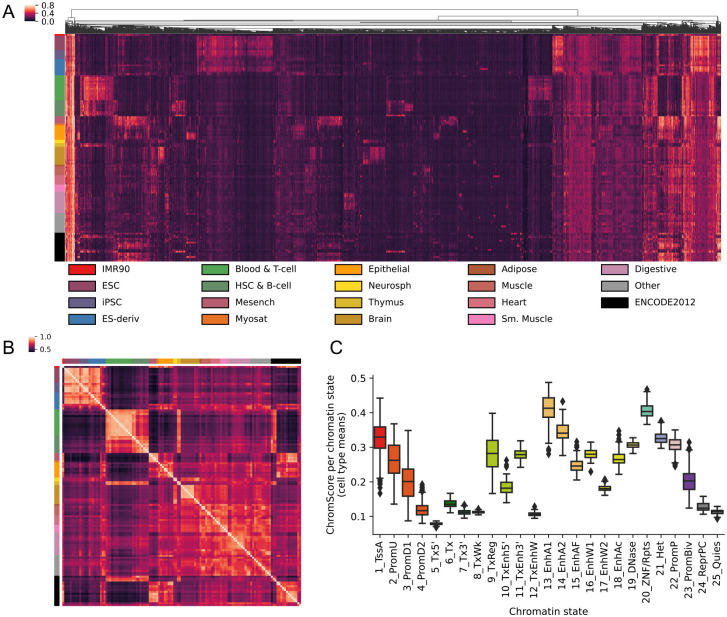
Figure 5: ChromScore across cell types.
(A) Heatmap showing ChromScores at 20,000 randomly selected bases across the genome (columns) that had a score difference of >0.25 between at least two cell types for 127 Roadmap Epigenomics cell types (rows) (Methods). Columns are hierarchically clustered and rows are sorted based on Roadmap Epigenomics tissue groups [9]. The tissue groups of the rows are indicated on the left and their color legend is displayed at the bottom. (B) Heatmap of ChromScore Pearson correlations across all pairs of 127 cell types, which are ordered and colored as in A. (C) Distribution of mean ChromScores per chromatin state per cell type.

