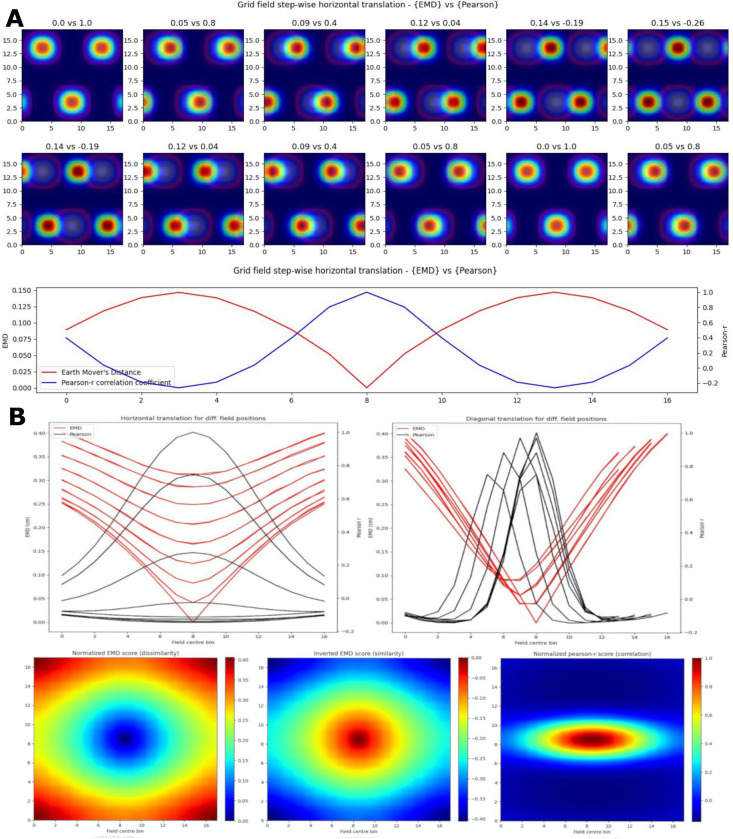
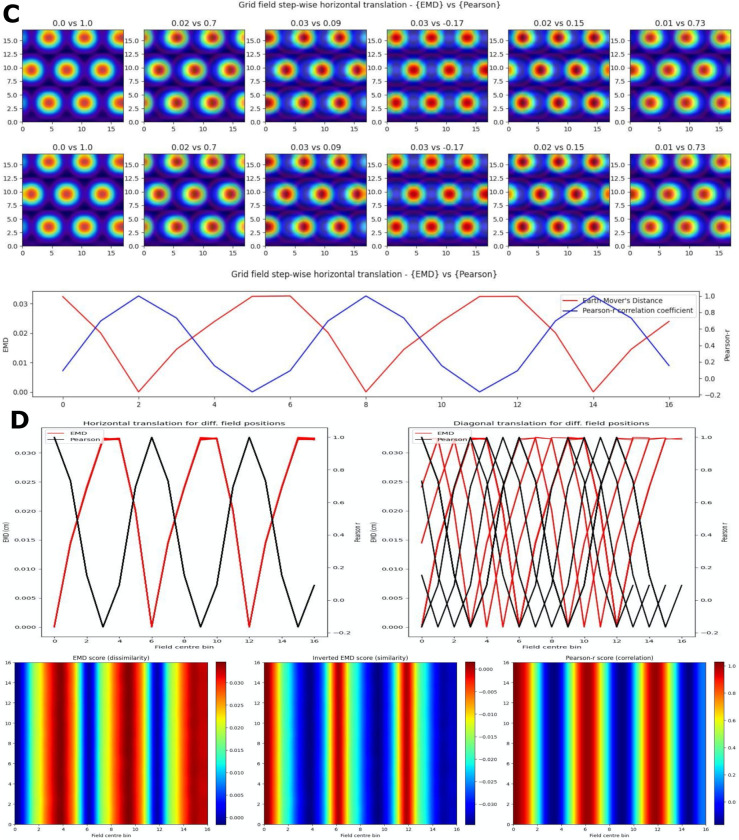
Figure 2. Identical grid field translation.
Stepwise horizontal linear translation of identical, overlapping grid fields (, ) moving from the top left corner to the right and/or downwards on a rate map (A, C). EMD score is shown on the left while Pearson’s r is shown on the right. 12 steps are shown and scores are rounded for display (top panel - EMD vs Pearson). Grid maps were sliced from a larger map with sufficient fields and bins to support N*N steps. Initial grid maps were chosen by taking a slice from the wider map. Scores from remapping tested across N*N different shifts from the initial grid map (0 to N combinations) (bottom panel). EMD and Pearson’s r scores tested at N*N different centroid positions on the wider grid (B, D). Scores for horizontal and diagonal translations along the rate map are shown for all rows (top panel). Heatmap showing the gradient of scores for both raw and inverted EMD (left and center) and for Pearson’s r (right) (bottom panel).


