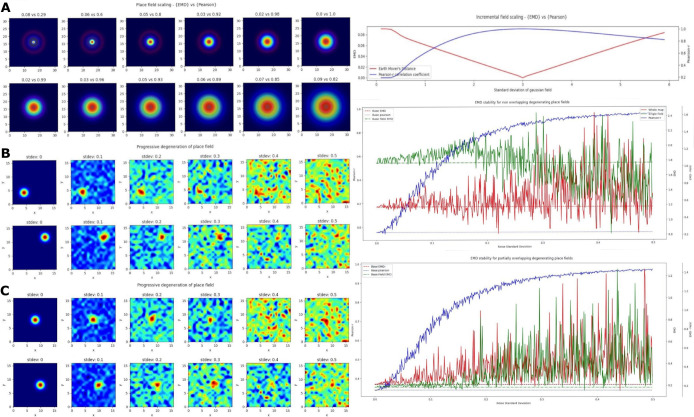
Figure 3. Incremental field degeneration.
Stepwise nonlinear translation of overlapping fields relative to a fixed field at . 12 steps are shown with 6 scaling down and 6 scaling up relative to the fixed field (A). EMD score is shown on the left while Pearson’s r is shown on the right (left panel). Scores from remapping tested across a range of standard deviations for the scaling field (right panel). Incremental field degeneration for a pair of fields, non-overlapping and overlapping (B,C). Left panels show the stepwise degradation in the rate map due to randomly sampled normally distributed noise with varying standard deviations. Noise standard deviations are shown above the rate map plots. The distribution plots show the computed remapping score between the pair of fields for the overlapping and non-overlapping cases. Both cases have values for the EMD (red), field EMD (green) and Pearson’s r scores (blue) displayed (right panels).

