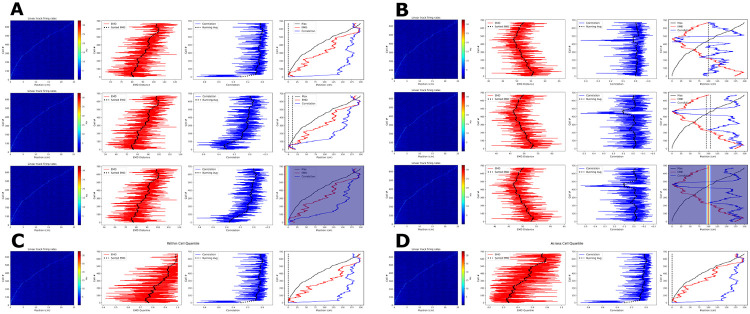
Figure 9. Place cell population decoding.
Place cell population decoding using a reference template and a population of 1D rates across a 200cm linear track. The first plot in a row shows a population map of linear firing rates. The second plot shows the distribution of EMD values, and the running average. The third plot shows the population of correlation values, and the running average. The last plot shows the peak firing rate trend overlaid with the running averages of each score distribution. Two sets of examples are provided with reference templates highest in density at the start (A) and in the center (B). In each set, the first row of plots uses a reference map with all the activity in a single bin. The second row uses a map with the activity spread out across 10 bins. The last row uses a 1D gaussian template with sigma = 5. Reference points, and windows, are plotted with a dashed black line in the final plot of each row. Reference gaussians are overlaid in the final plot of each row. Population decoding with quantiles instead of distances. Quantiles are computed using the distribution of EMD distances from all other cells (C). Quantiles are computed using the distribution of EMD distances from a given cell relative to random reference locations (D).

