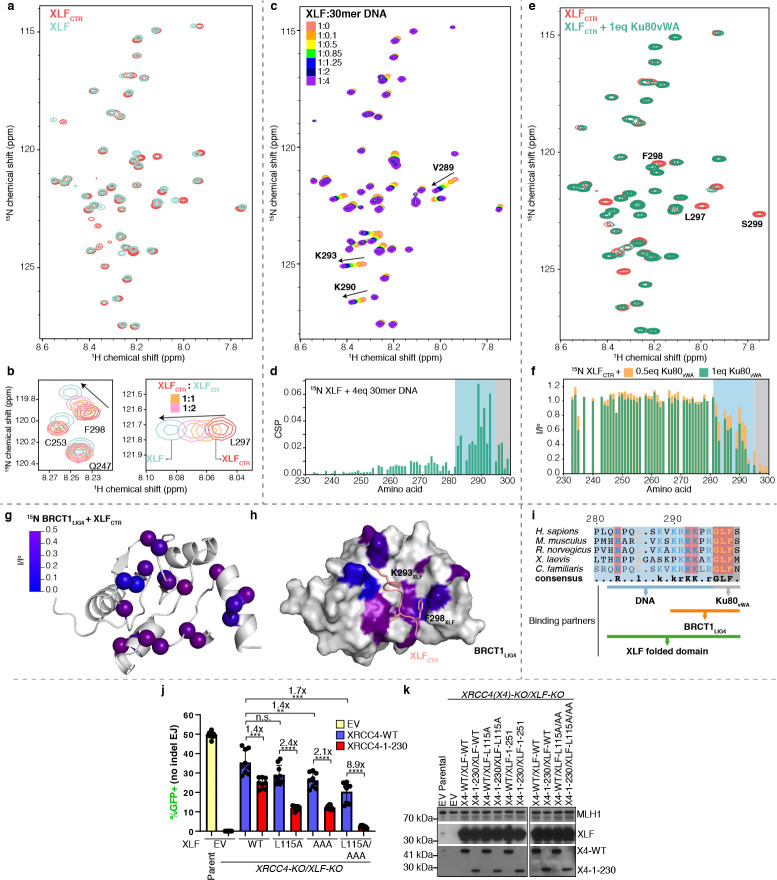
Figure 2. Multivalent interactions within the CTR of XLF.
(a) Overlay 1H-15N HSQC spectra of full-length XLF (cyan) and XLFCTR (red). (b) Insets from superimposed 1H-15N HSQC spectra of 250 μM XLFCTR (red) after adding one (orange) or two (pink) equivalents of XLF1–224 compared with the spectrum of full-length XLF (cyan). (c) Overlay 1H-15N HSQC spectra of 150 μM XLF recorded in a titration with 30mer DNA. (d) Chemical shift perturbations (CSP) of XLF upon addition of four equivalents of 30mer DNA. (e) Overlay of 1H-15N HSQC spectra of 50 μM XLFCTR alone (red) and in the presence of one equivalent of Ku80vWA (green). (f) Peak intensity ratios from 1H-15N HSQC spectra of 15N XLFCTR spectra comparing the intensity in the spectrum of XLFCTR alone (Io) and after adding 0.5 (orange) or 1 (green) equivalent of Ku80vWA. (g) The residues of BRCT1 that experienced significant peak intensity reduction (I/Io < 0.5) after adding XLFCTR are mapped as a color gradient (0: blue, 0.5: purple) on the structure of BRCT1 (generated by Alphafold-multimer). I/Io: normalized peak intensity of BRCT1 before and after adding two equivalents of XLFCTR. (h) The model of BRCT1-XLFCTR complex predicted by Alphafold-multimer (26), the affected residues are color-mapped as in (g). (i) Sequence alignment of the last 20 residues of XLF homologs. Conserved residues are colored with the following scheme: hydrophobic residues and glycine, orange; positively charged residue, blue; strictly conserved residues are highlighted in red. The residues of the CTR of XLF that interact with different partners are indicated. (j) Combining loss of the CTR of XRCC4, along with the XLFAAA/L115A mutant causes a marked decrease in cellular NHEJ. GFP frequencies are normalized to parallel GFP transfections to account for transfection efficiency. n = 9 biologically independent transfections. The values of XLFEV, XLFWT, and XLFL115A, with or without XRCC4WT or XRCC41–230 are the same as those in 1d. Statistics with unpaired two-tailed t-test with Holm-Sidak correction. #x represents fold effect. ****P<0.0001, ***P<0.001, **P<0.01, n.s. = not significant. (k) Immunoblots show levels XRCC4WT, XRCC41–230, XLFWT, and XLF mutants. Data are represented as mean values ± SD.

