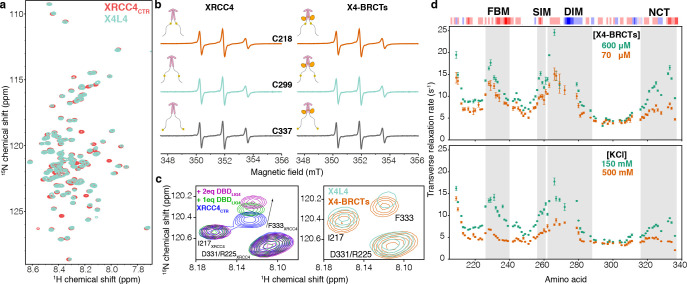
Figure 3. Multivalent interactions within the CTR of XRCC4.
(a) Overlay of 1H-15N HSQC spectra of XRCC4CTR (red) and XRCC4 in complex with LIG4 (X4L4, cyan). (b) CW-EPR spectra (X-band) recorded at room temperature for XRCC4 variants C218-MTSL (orange), C299-MTSL (cyan), and C337-MTSL (gray). The simulated spectra and the simulation parameters adopted for each spectrum are reported in S21). (c) Left: the inset shows a part of the superimposed spectra of 15N XRCC4CTR upon adding 1 (green) or 2 (pink) equivalents of DBDLIG4; right: the inset shows the same region of the superimposed spectra of 15N full-length XRCC4 in complex with LIG4 (cyan) or BRCT tandem (X4-BRCTs, orange), the shift of the peak corresponding to the residue F333 of XRCC4CTR is highlighted with the arrow. (d) upper panel: The transverse relaxation rate (R2) of backbone 15N nuclei for residues corresponding to the XRCC4CTR in the X4-BRCTs complex at concentrations 600 and 70 μM; lower panel: the R2 of backbone 15N nuclei for XRCC4 in the X4-BRCTs complex (300 μM) with KCl concentrations 150 mM (green) and 500 mM (orange). The R2 were measured at 298 K on the 800 MHz spectrometer. The four regions (FBM, SIM, DIM, and NCT) are highlighted in gray; the three-residue rolling charge distribution is displayed on top of the graph.

