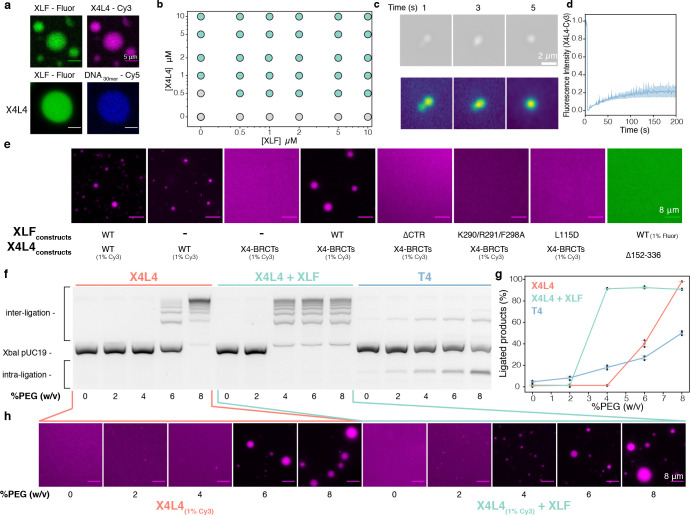
Figure 4. X4L4 and XLF undergo liquid-liquid phase separation in vitro.
(a) Co-localization of XLF with X4L4 and DNA within the droplets observed by the fluorescence microscopy with Fluorescein-labeled XLF, Cy3-labeled X4L4, and Cy5-labeled DNA, the scale bar is 5 μm. (b) Phase diagram of XLF with X4L4, the grey and green circles represent monophasic and biphasic solutions, respectively. (c) Droplet fusion event of X4L4 and XLF droplets (top), the same images are plotted as intensity gradient to highlight the contrast. (d) FRAP experiments of X4L4-XLF droplets, the experiments were carried out as duplicate. (e) Ability of different XLF and X4L4 constructs to undergo LLPS. The concentrations of all constructs were fixed at 10 μM, refer to (Fig. S19, S20) for a complete range of concentrations. (f) Image of an agarose gel after fractionation by electrophoresis and SYBR Green I staining of deproteinized cohesive end ligation products from reactions containing X4L4, X4L4-XLF, or T4 with an increasing amount of PEG8000. The substrate was 2.7 kb XbaI-linearized pUC19 plasmid. The reaction time was 5 min. (g) Quantification of ligated DNA of the reactions is shown on the left, the experiments were carried out in triplicate. (h) The same reactions as in (f) with 1% Cy3 labeled X4L4 were visualized using fluorescence microscopy. Data are represented as mean values ± SD.

