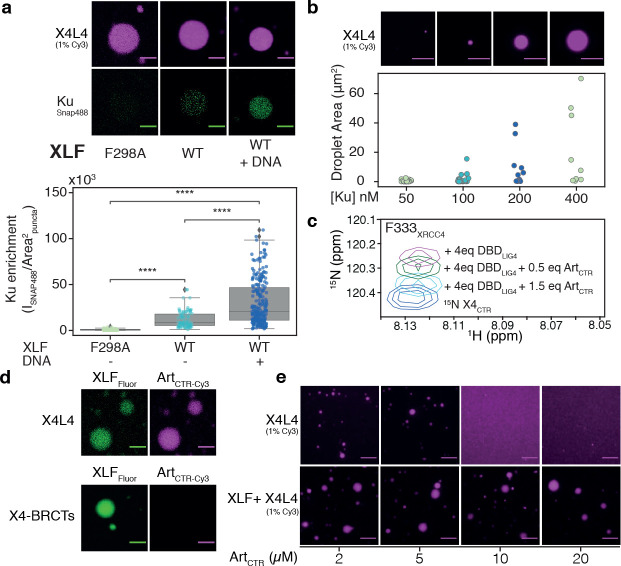
Figure 5. Effect of other NHEJ components on the LLPS of XLF and X4L4.
(a) Co-localization of X4L4 and Ku in the presence of XLF mutant(F298A, deficient in Ku binding) and WT XLF without or with the addition of DNA (blunt-ended Smal-linearized pUC19). The strip plot and boxplot show the quantification of the Ku enrichment in the puncta across multiple micrographs for each condition. Statistical significance was established using T-test (****P<0.0001). (b) upper panel: X4L4-XLF droplets with blunt-ended Smal-linearized pUC19 and increasing concentrations of Ku visualized by fluorescence microscope with 1% Cy3-labeled X4L4, lower panel: the strip plot of the droplet area across multiple micrographs for each condition, the concentrations of XLF and X4L4 were fixed at 0.5 μM, the experiment was duplicated and analyzed together. (c) The inset shows the peak of the F333 residues of XRCC4CTR extracted from the overlaid 1H-15N HSQC spectra of XRCC4CTR alone or in the presence of DBDLIG4 and ArtCTR. (d) Co-localization of ArtCTR in X4L4-XLF or XLF- X4-BRCTs droplets. (e) Fluorescence microscopy images of X4L4 (1% Cy3 labeled) in the absence or presence of XLF with increasing concentrations of ArtCTR. The concentrations of X4L4 (complex) and XLF (monomer) were fixed at 5 μM; all scale bars represent 8 μm. Data are represented as mean values and SD.

