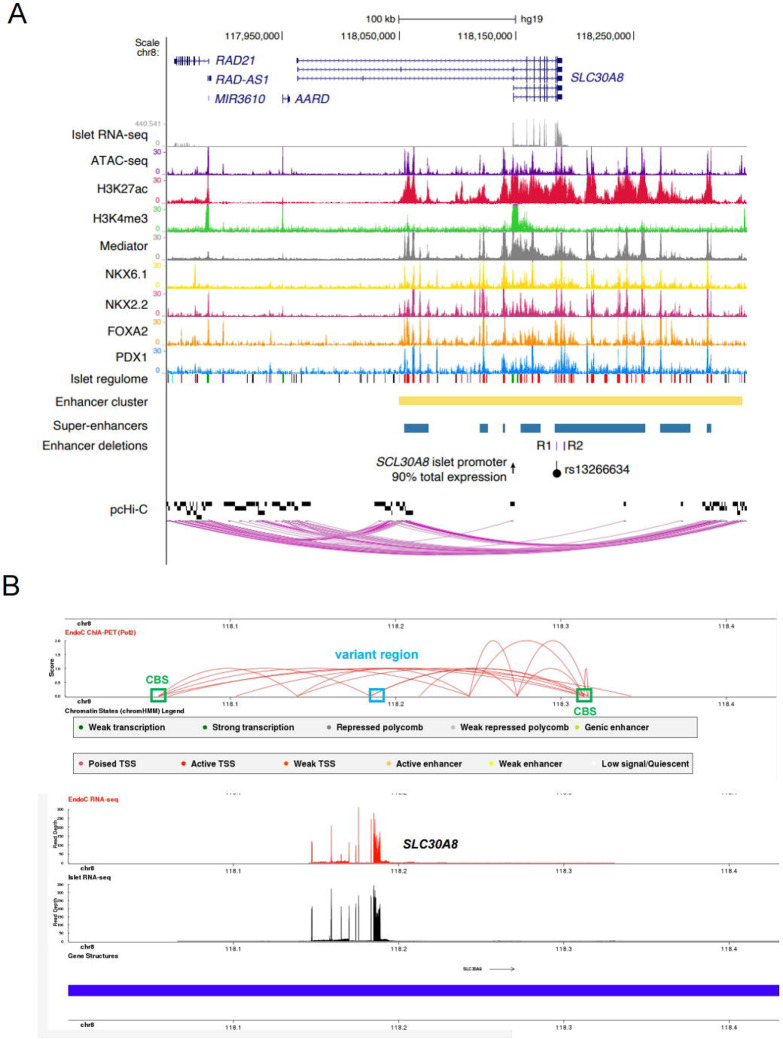
Figure 2. Combined epigenetic and chromatin maps at the SLC30A8 locus.
A. Integrative map of the SLC30A8 locus in human islets showing chromatin state profiles and chromatin interactions between the super-enhancer (in blue) and SLC30A8 and nearby genes, as determined by pcHi-C. R1 and R2 enhancer elements in the super-enhancer domain are coloured in purple. The lead T2D GWAS variant rs13266634 is represented as a black dot. B. CHIA-PET map [65] of the SLC30A8 locus showing spatial contacts between the variant region and nearby regions. Polymerase II antibody was used to pull down protein/genomic DNA complex followed by whole genome sequencing [65]. Blue box: the variant region. Green box: CTCF binding sites (CBS) representing the 5’ and 3’ end of the super-enhancer cluster. Note that the variant region is spatially associated with the CTCF binding sites of the enhancer cluster.

