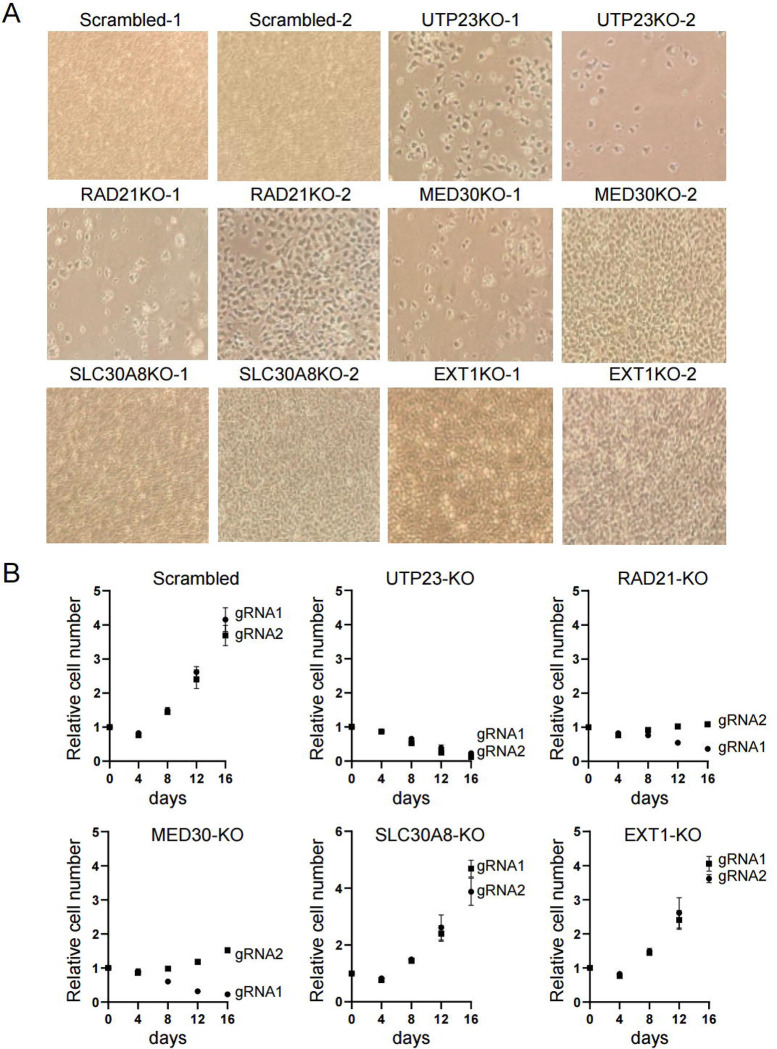
Figure 7. Impact of gene inactivation on cell survival.
Two gRNAs were designed for each gene, cloned individually into pLenti-RIP-Cas9-BSD vector and delivered into 1 million EndoC-βH3 cells via lentiviral approach. Cells were selected with Blasticidin (25 μg/ml final concentration) for a week and cultured continuously for another 3 weeks. A. Morphologies of gene knockout cells. Photos were taken at the end of 4-week culture. Note that cells with scrambled gRNAs were confluent, along with SLC30A8-KO and EXT1-KO cells while RAD21, MED30 and UTP23 had significantly fewer surviving cells. B. Growth curves of control (scrambled) and gene-inactivated cells. At each time points, cells were fixed with formaldehyde and stained with crystal violet. Cell-associated dye was extracted with acetic acid and measured at 590 nm. The values were then normalized to the density at day 0.

