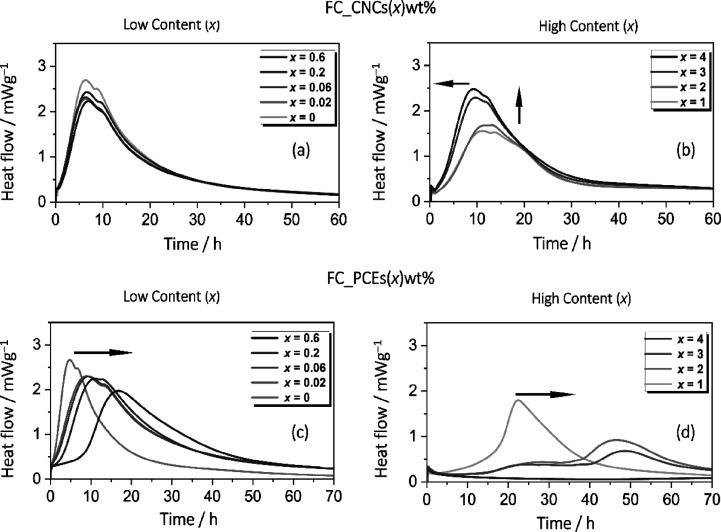
Figure 2.
Hydration kinetics characterization of fiber-cement slurry. Isothermal calorimetric (ITC) curves as a function of (a, b) CNC wt % (x) and (c, d) PCE wt % (x), respectively. Note that the horizontal arrow represents the trends of time it takes for the fiber cement sample containing additives to attain the main peak of hydration (silicate hydration peak) and the vertical arrow indicates the improvement in heat of hydration of the silicate hydration peak.

