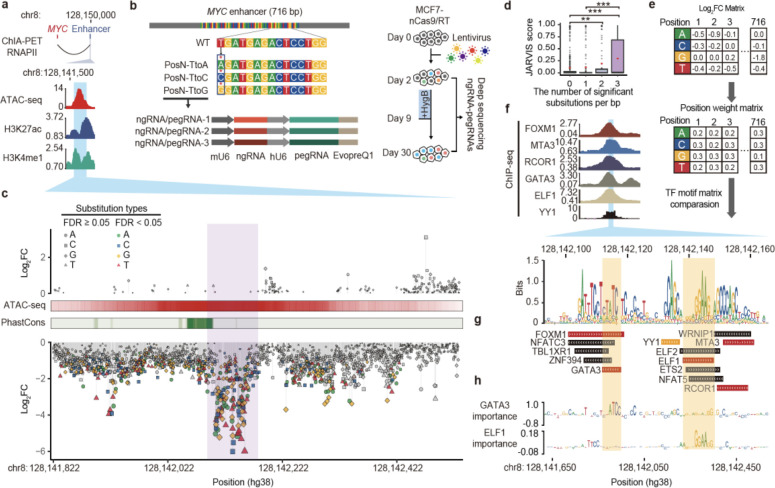
Figure 2. Functional characterization of a MYC enhancer by saturation mutagenesis using PRIME.
(a) (Top) The target enhancer is downstream of MYC. (Bottom) The enhancer region is highly enriched with ATAC-seq, H3K27ac, and H3K4me1 ChIP-seq signals. The blue area indicates the region selected for PRIME. (b) (Top) Diagram showing the design of saturation mutagenesis screening at the 716 bp enhancer. Each nucleotide was subjected to substitution with three nucleotides by PE. (Middle) Each substitution event was covered by three uniquely designed pegRNA/ngRNA pairs. (Bottom) The PRIME workflow. (c) Log2(fold change) of each substitution at each base pair ordered by their genomic locations. Mutations with a significant effect on cell fitness are colored. ATAC-seq signals and conservation scores calculated by PhastCons are shown. (d) JARVIS scores for base pairs with different numbers of significant substitutions. Box plots indicate median, IQR, Q1 − 1.5 × IQR, and Q3 + 1.5 × IQR. Outliers are shown as gray dots. Mean values are shown as red dots. P values were calculated using a two-tailed two-sample t-test. (e) The creation of a functional PWM for identifying potential TF binding sites. (f) (Top) ChIP-seq signals of 6 TFs in MCF7. The blue region indicates the core enhancer region. (Bottom) The sequence logo plot for the core enhancer regions generated by the functional PWM from (e). (g) Matched TF binding sites. (h) (Top) Dense tracks showing BPNet model-derived nucleotide importance scores for GATA3 and ELF1 binding sites.

