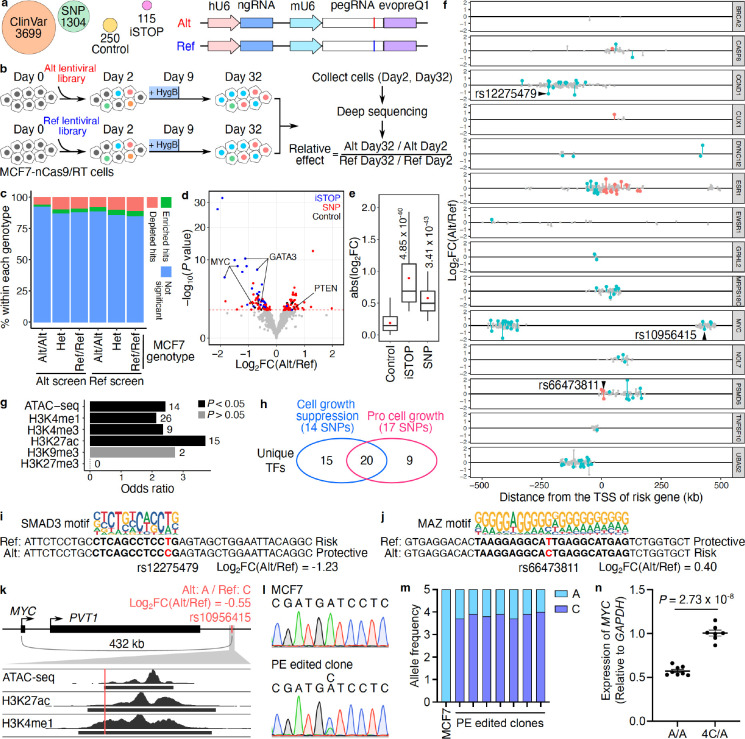
Figure 3. PRIME reveals functional SNPs associated with breast cancer.
(a) Alt and Ref library design overview. In the design, we included breast cancer-associated variants (SNP), clinical variants (ClinVar), introduced stop codons (iSTOP), and non-targeting controls. For each variant, pegRNA/ngRNA pairs introducing either the Alt or Ref allele were designed. (b) Workflow of PRIME with Alt and Ref libraries. MCF7-nCas9/RT cells were infected with either lentiviral library. Cells were collected on days 2 and 32 post-infection. The abundance of pegRNA/ngRNA pairs in the samples collected on days 2 and 32 were deep sequenced. The relative effect of each variant was determined based on its relative impact on cell growth between Alt versus Ref alleles. (c) The percentage of significant hits (FDR < 0.05) identified from Alt and Ref screens for Alt/Alt, Het, and Ref/Ref genotypes in MCF7. (d) The functional SNPs (red) with either a positive or a negative impact on cell growth were determined by their relative effect in the Alt versus Ref screens. Blue dots represent significant iSTOPs, and black dots represent controls. The red dashed line indicates 0.05 FDR. (e) Absolute effects of identified functional iSTOPs and SNPs are higher than the effects of negative controls (P values were calculated by two-tailed two-sample t-test). (f) The genomic distance of SNPs tested at each risk locus relative to each gene’s TSS. Red dots are functional SNPs within gene bodies, blue dots are functional SNPs in distal regions, and gray dots are SNPs with non-significant effects. (g) Relative enrichment of genomic features for identified functional SNPs (P values were calculated by two-tailed Fisher’s exact test). The numbers of SNPs overlapping each genomic feature are labeled next to each bar. (h) Venn diagram showing the numbers of unique transcription factors (TFs) with differential binding sites centered on functional SNPs. The numbers of SNPs that alter TF binding sites are also in the parentheses. (i, j) Examples of functional SNPs disrupting TF binding sites. (i) The Alt protective allele of rs12275749 (position shown in f) affects the SMAD3 binding site and (j) The Alt risk allele of rs66473811 (position shown in f) is matched with the MAZ binding motif. (k) rs10956415 located within a candidate enhancer region overlapping with ATAC-seq, H3K27ac and H3K4me1 peaks in MCF7 cells. (l) Representative Sanger sequencing results for the rs10956415 locus in unedited MCF7 cells and a PE edited clone. (m) Allele frequencies of alternative (A) and reference (C) alleles of rs10956415 in unedited MCF7 cells and PE edited clones. (n) Relative MYC expression in control clones and PE edited clones (P = 2.73 × 10⁻⁸, two-tailed two-sample t-test).

